


By Joseph D’Aleo
The Inspector General wrote on behalf of NOAA a response to Congressman Barton and Rohrabacher and the other committee members about the issues raised about the US climate data base (USHCN) (see attached letter and report here). They spoke with the NWS, NCDC, ATDD, several state climatologists, the AASC, the USGRP and the AMS to form their response. They examined quality control procedures, background documentation, operating procedures, budget requirements and management plans.
They examined the USHCN program to ensure that steps were taken to ensure quality control of the data. NOAA admitted to issues with siting, undocumented relocation, instrument changes, urbanization and missing data but claimed that these issues were being addressed in their new version 2 with its new ‘pal reviewed’ algorithm designed to detect “previously undisclosed inhomogenieties”.
The write up and description of the process of pal review is very amusing including an internal review, a mixed journal review with one reviewer claiming a number of issues had not been addressed. Ironicaly the reviews were apparently with one exception accidently eaten by the NOAA mascot dog and were unavailable to the Insprector General. Though there was one negative review, the Bulletin of the American Meteorological Society, not surprisingly given their advocacy goal, chose to publish it giving it ‘peer review’ status credit.
The inspector general spoke with several other individuals not directly involved in the review process and got comments from one that NOAA needed to explain the process more and a humorous claim by the chair of the Applied Climatology committee of the AMS that the developers of the new algorithm did a ‘fantastic job’ with the new algorithm.
All reviewers to their credit admitted there was a need for an improved climate data set not requiring the many adjustments made to the existing one. NOAA is requesting $100 million to implement a new national station network. This is so even though the pilot program in Alabama cost only $30,000 to implement and make operational. It’s only your tax dollars. Though they argued against what Anthony Watts, Roger Pielke Sr, I and others have claimed about the issues with their network, this is an tacit admission that these issues were real and in need of addressing (progress made).
THE VERSION 2 ALGORITHM
Despite intimation that the algorithm corrects for all the deficiencies ADMITTED by NOAA, the new algorithm really only address 2 well. It is a change point algorithm looking for discontinuities that would indicate previously undocumented station moves/land use change or instrument changes. It is not clear how many of these issues among the 1221 stations in the network were uncovered with the new algorithm.
Here is an enlarged version of the example (courtesy of Anthony Watts surface station.org effort) of a land use change that the new algorithms ‘should’ have caught.
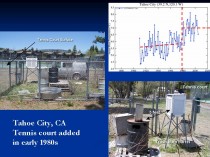
Here a tennis court was built around a station in Tahoe City CA. The enclosure around the Stevenson shelter, housing the sensor included a trash burn barrel within 5 feet. The data plot for Tahoe City reflected the change made around 1980.
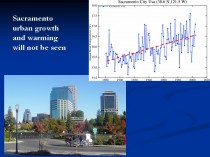
What is left uncovered and unaddressed are far worse issues, urbanization and bad siting. The new algorithms would never catch the following slow ramp up of temperatures you find in most cities and towns as they grow (as in Sacramento below, enlarged here. Oke (1973) noted that even small towns can develop a significant urban warm bias (population of just 1000 - 2C).
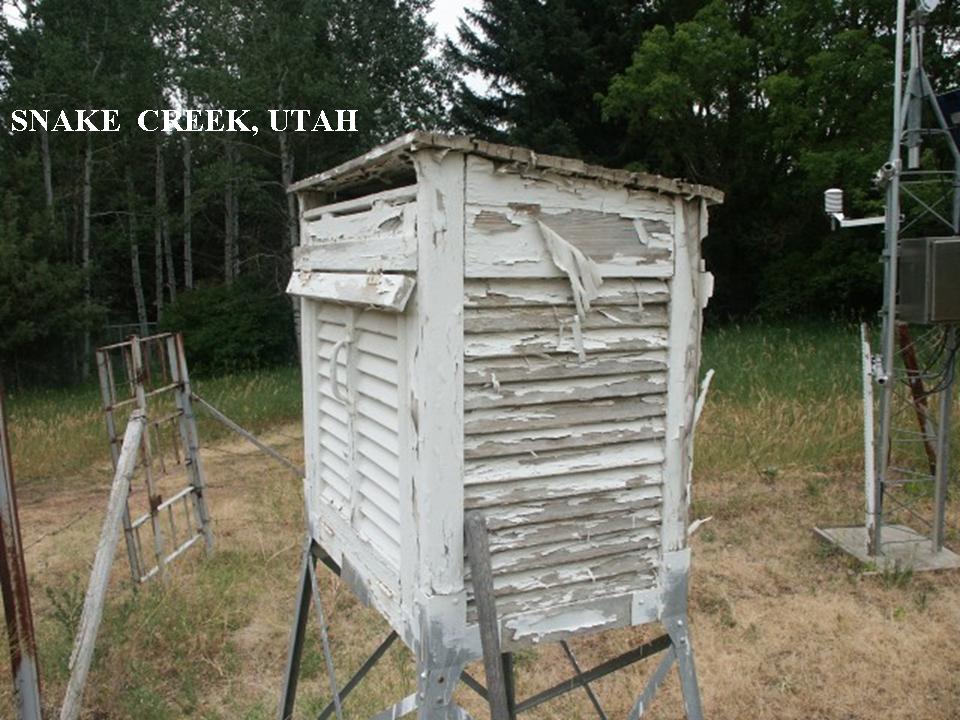
Nor would the new algorithm catch the slow degradation of siting as trees grow up and pavement, buildings or other heat sources slowly encroach around a station or the shelter is not properly maintained as in the Snake Creek, Utah one below enlarged here.

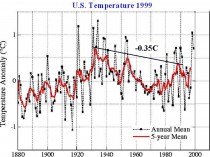
In actual fact version 2 took a step backwards by removing a previous urbanization adjustment. Far more stations both urban areas and even small to moderate size towns exhibited growth and many airports saw growth of the city around them. This introduced a warming trend in what had been a cooling linear trend since 1940 and about which even James Hansen admitted in 1999:
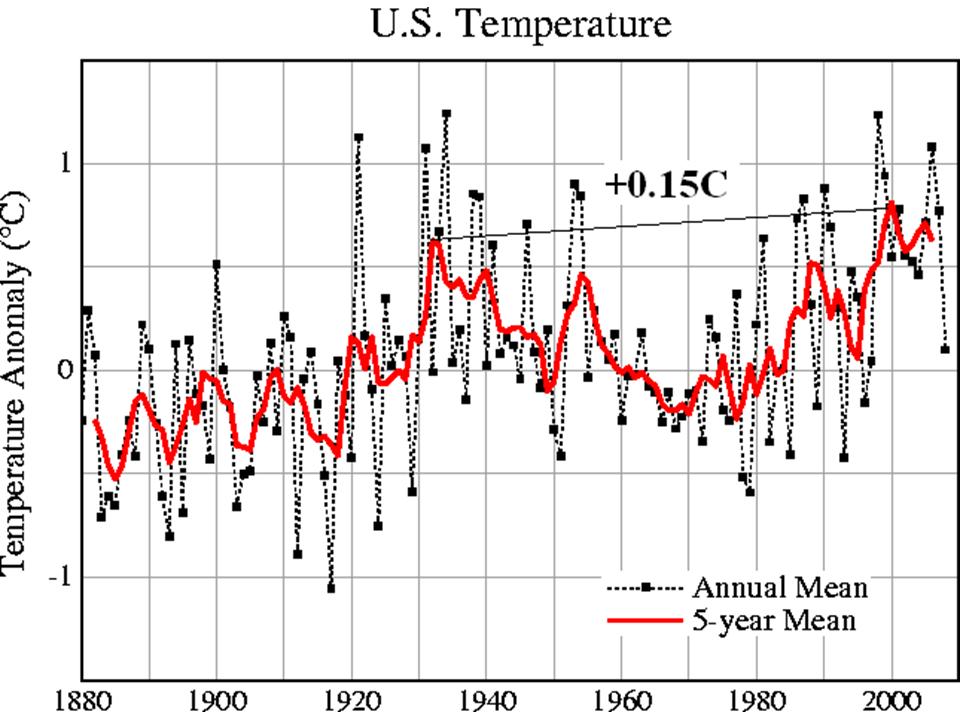
“The U.S. has warmed during the past century, but the warming hardly exceeds year-to-year variability. Indeed, in the U.S. the warmest decade was the 1930s and the warmest year was 1934.”
The temperature plot at that time in USHCN version 1 looked like this (enlarged here) with the recent warming significantly less than that around 1940.
After removing the urban adjustment in 2007, the US plot looked like this (enlarged here.
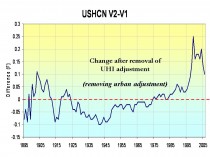
The difference in the two is shown below (enlarged here):
This change introduced a cooling of the previous warm period from the 1910s to 1940s and a warming post 1985 but especially after 2000.
IS THE URBAN ADJUSTMENT REALLY NECESSARY?
Literally dozens of papers have documented it is. See our paper on Surface Temperature Records: A Policy Driven Deception for a lengthy discussion of it and of the siting issue which despite NCDC’s claims is not properly addressed for in the version 2. Almost every night your local television broadcaster will make a forecast like ‘lows tonight in town near 60 but down in the upper 40s the colder (more rural) spots.’
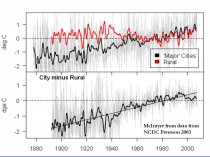
NOAA uses a paper by their own Tom Peterson who played statistical games with a data set and claimed it showed an urban adjustment was no longer needed.
Steve McIntyre challenged NOAA’s Peterson (2003), who had said, “Contrary to generally accepted wisdom, no statistically significant impact of urbanization could be found in annual temperatures” by showing that the difference between urban and rural temperatures for Peterson’s own 2003 station set was 0.7C and between temperatures in large cities and rural areas 2C (below, enlarged here).
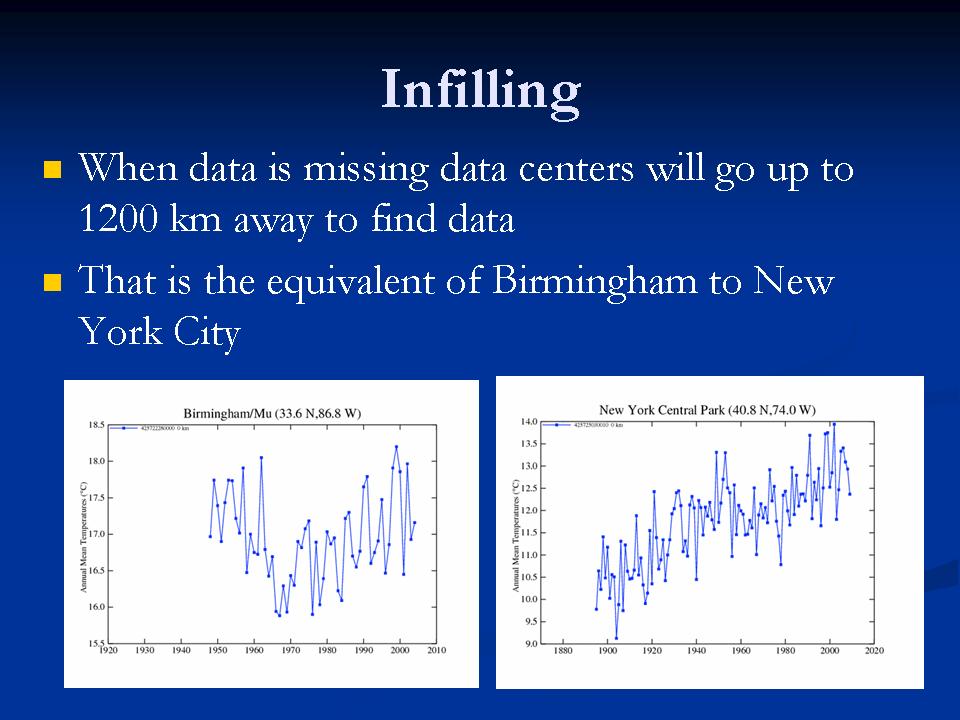
Despite the new algorithm which might catch a few station moves or changes that previously went undocumented, NOAA’s USHCN remains seriously flawed. In fact it is likely WORSE than it was a decade ago when it adjusted for urbanization. Ironically their global data set GHCN is even less trustworthy because it has huge holes in and much more missing monthly data requiring infilling, a process that may require using data from 1200km away to estimate the missing data (the equivalent of using New York City to fill in for missing months in Birmingham, Alabama) (below, enlarged here).

More to come. See PDF here.