


By Lucia, the Blackboard
Update: I said if I found temperature for the lower 48 I’d run them. I did and it totally revised my conclusions. It seems white noise isn’t such a bad assumption for temperatures in the lower 48, and the probability of the recent event really is quite low. I revised at the end!
-----
At wunderground.com Jeff Masters writes
U.S. heat over the past 13 months: a one in 1.6 million event
I call BS on that claim.
He goes on:
Each of the 13 months from June 2011 through June 2012 ranked among the warmest third of their historical distribution for the first time in the 1895 - present record. According to NCDC, the odds of this occurring randomly during any particular month are 1 in 1,594,323. Thus, we should only see one more 13-month period so warm between now and 124,652 AD–assuming the climate is staying the same as it did during the past 118 years. These are ridiculously long odds, and it is highly unlikely that the extremity of the heat during the past 13 months could have occurred without a warming climate.
What this really is is a meaningless statistics.
Let’s look at how it is computed.
Someone assume we have an unfair coin and the probability of getting heads is 1/3rd. What are the chances of getting 13 heads in a row? The answer is 1 in 313 = 1 in 1,594,323.
Okey. Dokey.
Here’s the problem: That calculation only applies to cases where the results for each coin flip are statistically independent or at least uncorrelated. This would make sense if we believed that month-to-month variations in temperature anomalies could be described by something called “white noise”.
But this is not true for monthly temperature and would not be even absent climate change. We know that month-to-month variations in temperature are correlated. This is so well understood that NOAA has names for large persistent weather patterns. Names like “El Nino/La Nina” (i.e. ENSO). Other persistent weather patterns exist.
In fact - the entire reason weather forecasting is possible at all is that we know weather patterns persist. Master’s calculation is based on the assumption weather patterns do not persist!.
Let’s tweak Dr. Master’s rather imperfect calculation by retaining his assumption that “climate is staying the same as it did during the past 118 years” but accounting for “persistence”. More specifically we will assume that there is non-zero serial auto-correlation in the monthly data. Since he used “white” noise, I’m going to pick the next simplest model: Red noise (i.e. AR1 noise.)
Master’s used continental US data. Because I have easy access to NOAA’s global data and have already coded a script to read it, I’ll use global data instead of data for the lower 48. (If someone gets me data for the continental US, I’ll repeat in an update.)
I start by downloading data from Jan. 1895 to Jun. 2012 from NOAA here.
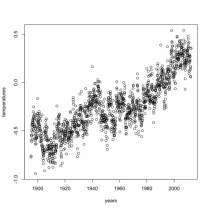
I fit a model that assumed the temperature exihibits no systematic trend and with monthly variability modeled by “red” noise, (instead of Master’s choice of “white"). Doing so I estimate a lag 1 coefficient of R=0.936.
Next, I create a series of 1409 ‘months’ worth of data synthetic “weather” that is nothing more than “red noise”. I inspect the final 13 months to see if the minimum value is in the top 1/3rd of temperature based on the temperature record - but excluding the final 13 months themselves. If all thirteen months are in the top 1/3rd, the outcome for this case is 1. Otherwise, it’s 0.
Then, confident that it will not take 1,594,323 tries to end the string with a record, I repeated this computation 10^4 times. This results in a string of 10,000, 0s and 1s. Taking the mean of the series, I found that “assuming the climate is staying the same as it did during the past 118 years” the probability of 10% plus/minus 0.4% the final 13 months would fall in the top 1/3rd of historic temperatures observations.
Note that 1 in 10 times is much more likely than 1 in 1,594,323.
And my calculation is for the entire surface of the earth. I’m not cherry picking by finding the one country that happens to be having a sustained heat wave while other parts of the world are not experiencing the same heat wave.
So, what does the 10% probability this mean about global warming?
Nothing. Absolutely nothing. What this means is that trying to demonstrate global warming by estimating the odds of getting 13 months of temperatures in the top 1/3rd of historic records under the assumption that the climate has not changed is often a stoooopid way of proving or disproving global warming.
Heaven knows, as a method to analyze the temperature data the method I used has flaws– all I did was remove one of the obvious flaws in Jeff Masters’s method. But with one less flaw than his method, my estimate of 10% probability this would happen is certainly no worse than the estimate Jeff Masters posted at WunderBlog.
For those wondering if I have a swag of how likely this event would be if climate change had not happened: it’s 1.4%. That’s just a swag based on detrending and then computing R. But, using that value, assuming a lifetime of approximately 70 years, one would expect to see this sort of excursion heat wave happen even without climate change. As it happens, I think the planet has warmed. But someone is going to have to do a lot better than Jeff Master’s to turn this heat wave by itself into proof the climate has warmed.
Update: I googled to read who’d blogged. Michael Tobis commented:
Actually that’s bad form from both Masters and NCDC.1.6 million (more precisely, 1,594,323) to one is just the thirteenth power of 1/3, which overstates the case to the extent that successive monthly anomalies are correlated. (Also the 1/3 is somewhat arbitrary and could be a cherry pick, but leave that aside). I don’t doubt that something very odd is going on but the number represents a common elementary statistical error and is in this case excessively alarmist.
Is this the first time MT and I have agreed on something? ![]()
Update Wow! I didn’t realize the US temperatures had such low serial auto-correlation! I obtained data for the lower 48 states here.
Based on this, the lag 1 autocorrelation is R=.150, which is much lower than R=0.936. So ‘white noise’ isn’t such a bad model. I am getting a probability less than 1 in 100,000. I have to run the script longer to get the correct value!