Joseph D’Aleo, CCM
Ian made landfall as a strong CAT4 storm. The damage will rank among that with the past worst storms. Its’ life is not over as it will landfall again in South Carolina with rain the biggest story to come.
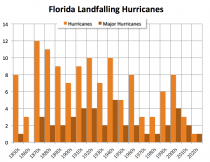
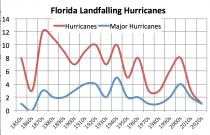
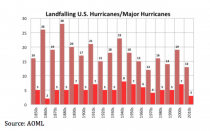
See the trends per decade of landfalling Florida hurricanes and major hurricanes since 1850.
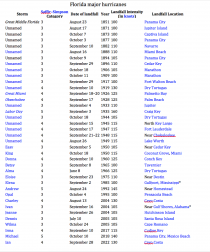
Here is a listing of the Major Hurricane landfalls in Florida.
My compadre, Joe Bastardi noted on Hannity “There were SIX hurricanes that hit the Southern part of Florida, below a line from Tampa to Cape Canaveral on the Atlantic in the last 57 years. If you look at the prior 50 years, there were SIXTEEN strikes!”
Dr. Neil Frank, longest serving Hurricane Center Director advises::
“Without question the most reliable indicator of a trend in hurricane activity in the Atlantic is to focus on land falling major hurricanes (3-5) in the mainline U.S. I doubt if a major hurricane could have hit the U.S. in the 1800s without being noticed, while a minor hurricane in a remote area could have been undetected so it is important to concentrate on major hurricanes. It is important to emphasize that the rainfall in a tropical system is not related to the intensity but depends on the forward speed of motion. In the case of Harvey, the weakening hurricane stalled over southeast Texas for three days. Finally, as you know the most active hurricane season in the U.S. was 1886 when 7 hurricanes hit the Gulf coast. One of the major hurricanes in Texas destroyed Indianola on the south shore of Matagorda Bay. At one time there were around 20,000 people in the city before a prior major hurricane in 1875 did major damage. The only thing in Indianola today is a cemetery with numerous headstones with dates 1875 or 1886 ”
The US trend like Florida is down.
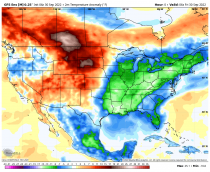
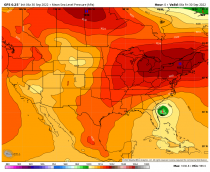
Ian encountered a ‘cool’ upper trough and large, chilly surface high to the north, which deflected it northeast through Florida before feeding off the Gulf Stream to become a hurricane again and resuming its journey poleward.
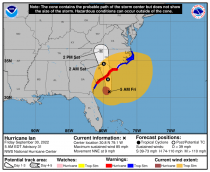
See Ian’s track for landfall #2.
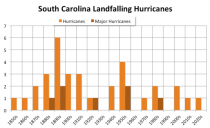
I have added a landfall to South Carolina chart as probably a CAT 1. The trend too here is down. The 1890s was the big decade. The most recent landfalling major was Hugo, a CAT4 in 1989.
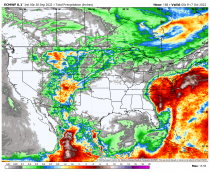
See the heavy rains coming inland again the next several days.
See the latest Sea Surface Temperature anomaly chart. The La Nina cold water shows in the Pacific and warm pools in the northwest Pacific and northwest Atlantic.
These are due to a lack of early to mid-season hurricanes in these areas (until one developed and tracked to the Bering Sea and Alaska). Hurricanes usually track these areas in the late summer and fall. The tropics heat up with the intense high in the sky sun in the summer. Currents carry some of that heat north but this is slow and nature created hurricanes to speed the process. If these warm pools persist they can affect the winter patterns.
By the way, here is a document with trends for all the east and Gulf States. Only Alabama has an uptrend. But Alabama maximum average temperatures yearly since 1895 have declined for May to October.
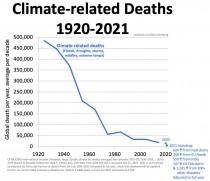
Bjorn Lomborg, author of ‘False Alarm; ‘Cool It’ and ‘Skeptical Environmentalist’, president Copenhagen Consensus think tank smart solutions through economic prioritization blogs “Climate’related deaths are down 98% in the last 100 years thanks to our access to energy.”
See a very detailed summary of the media's lies about the real trends by Michael Schellenberger here.
See Alex Epstein’s 25 myths about extreme weather, refuted


_thumb.png)

