


By Joseph D’Aleo, CCM, Weatherbell Co-Chief Meteorologist
Texas started it all last year, and the palpable pain they felt that was so apparent in the comments received on the Weatherbell site, has spread north like a disease. The Midwest is where the blistering heat has focused this year. The drought is significant and has decimated the corn crop. It is the worst drought since 1988, when corn crop yields fell 30% below trend line yields.
It is driven by the warm pool northwest of Hawaii, the relative warmth NINO12 (+1.1C) versus the NINO34 (+0.5C) (we explain how these two factors are keys on Weatherbell.com) and antecedent conditions.
It was a warm dry zonal winter with the cold trapped in Alaska (still is). The pattern is stuck and persistent. This is the November 2011 to July 22, 2012 anomaly for North America.
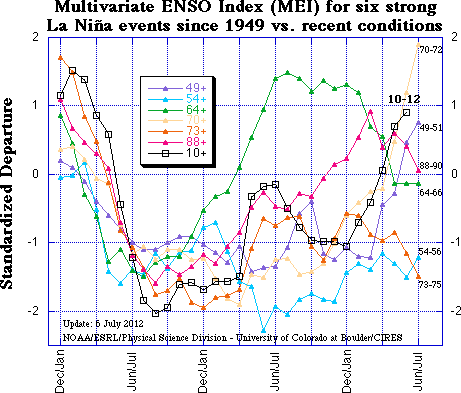
The worst droughts for Texas were in 1918, 1956 and 2012, according to Texas State Climatologist Nielsen-Gammon. Those three years 1918, 1956 and 2012 were the strongest La Ninas according to the MEI and SOI. See how this two year bottomed just above 1956’s summer MEI.

Enlarged
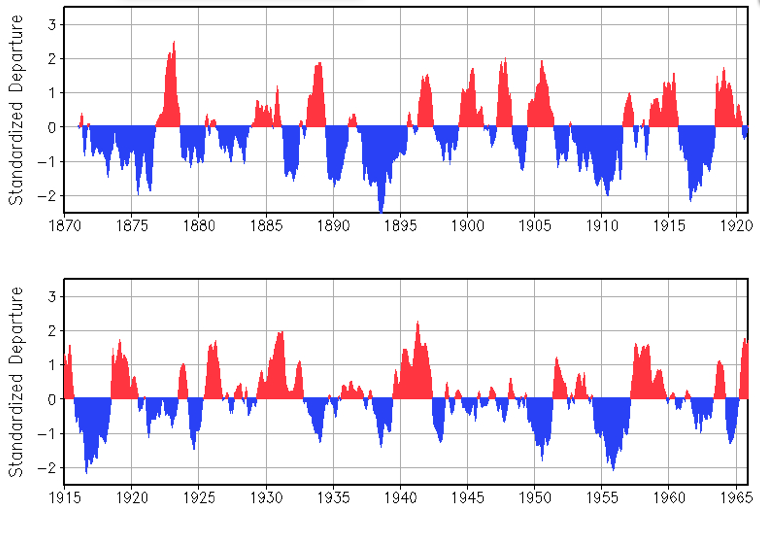
In the extended MEI series see 1918 was right there with 1956, 2012. La Ninas mean dry for Texas, super La Ninas super dry. Super dry mean super hot.

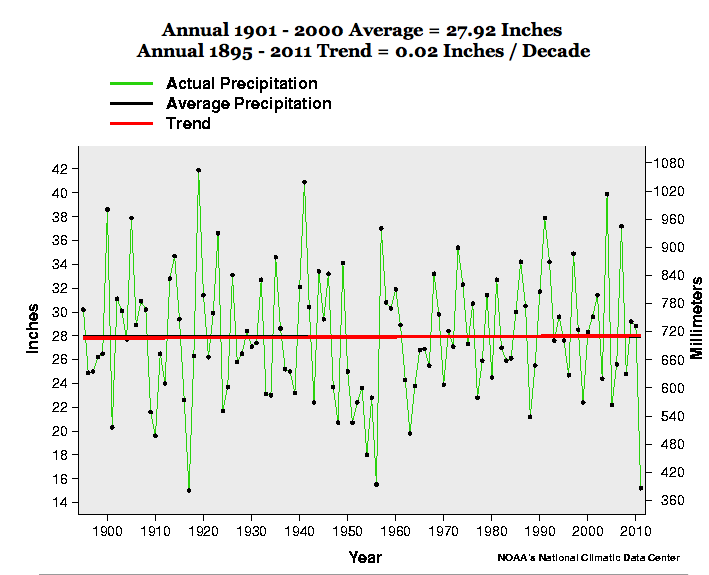
You can see the clustering of drought years for Texas in the 1950s and in the 1930s in the graph that follows. For the United States as a whole the 1930s was the worst decade for drought - The Dust Bowl Years. Again here 1918, 1956 and 2012 stand out. The trend is actually up.

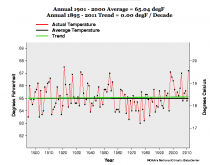
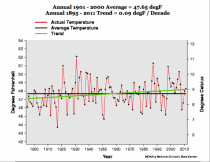
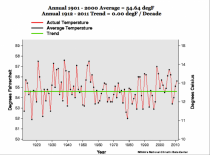
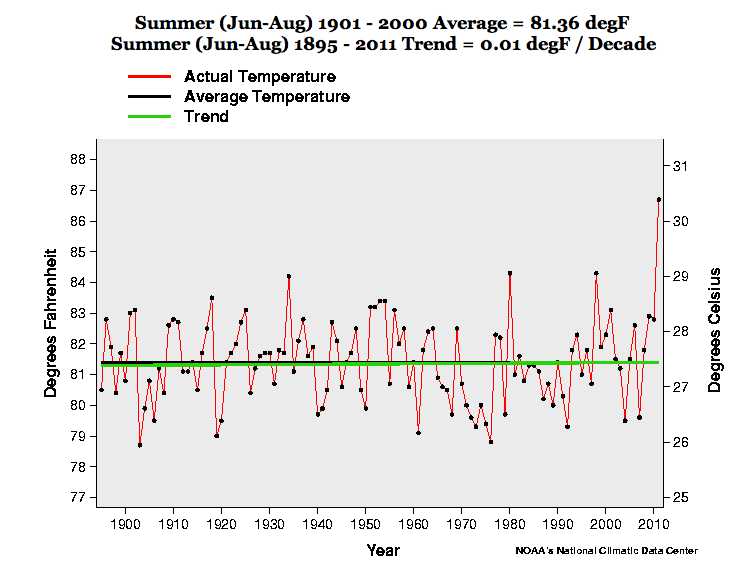
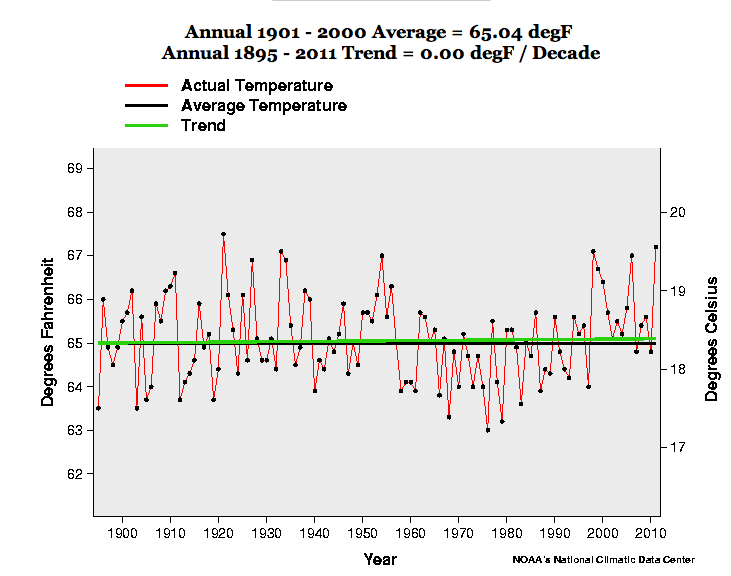
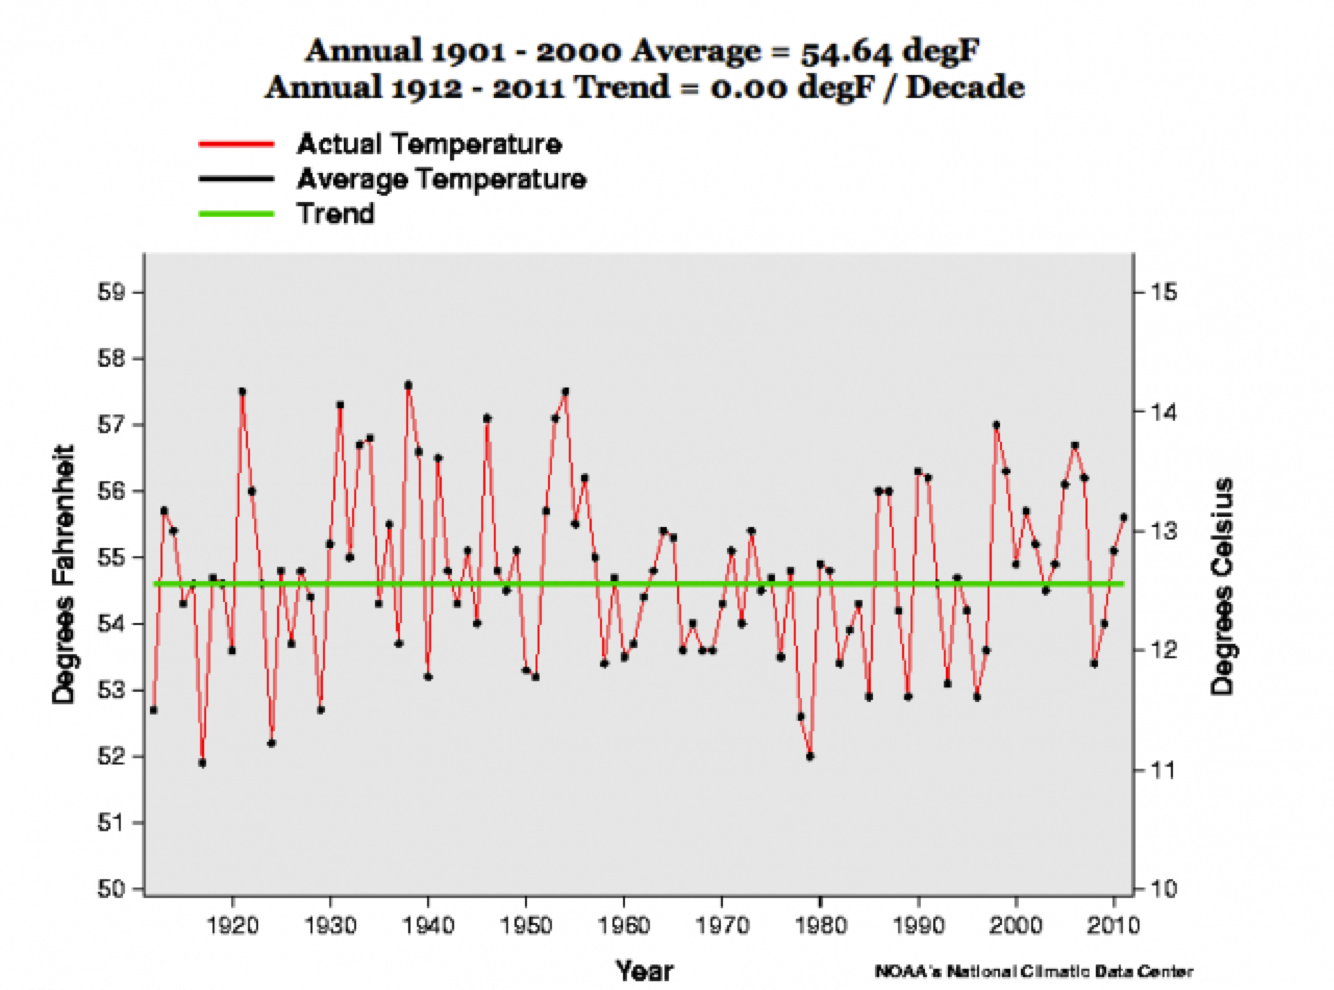
Summer heat the last century peaked in 1934, 1980 and 1998 and then 2011 in Texas with no discernable trend since 1895. This is the summer anomalies for Texas through 2011.

The annual trend is 0.00F/decade.
Enlarged
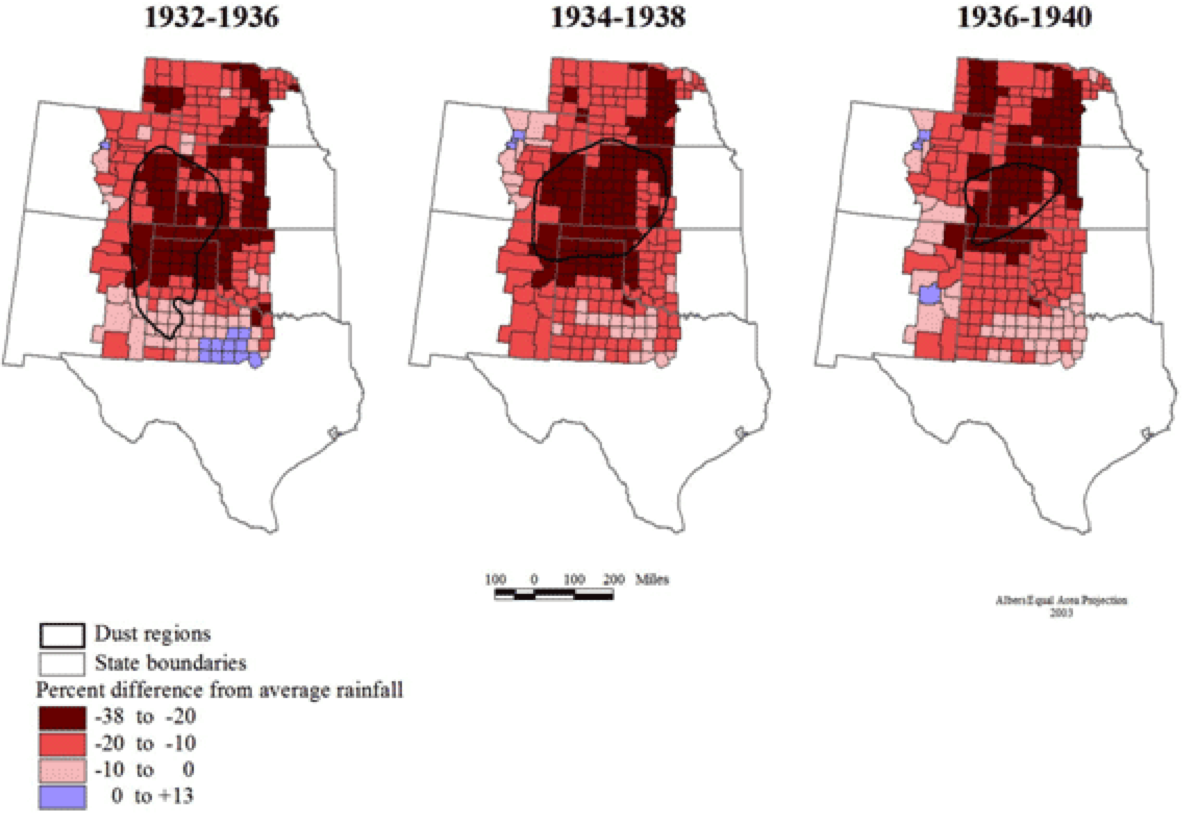
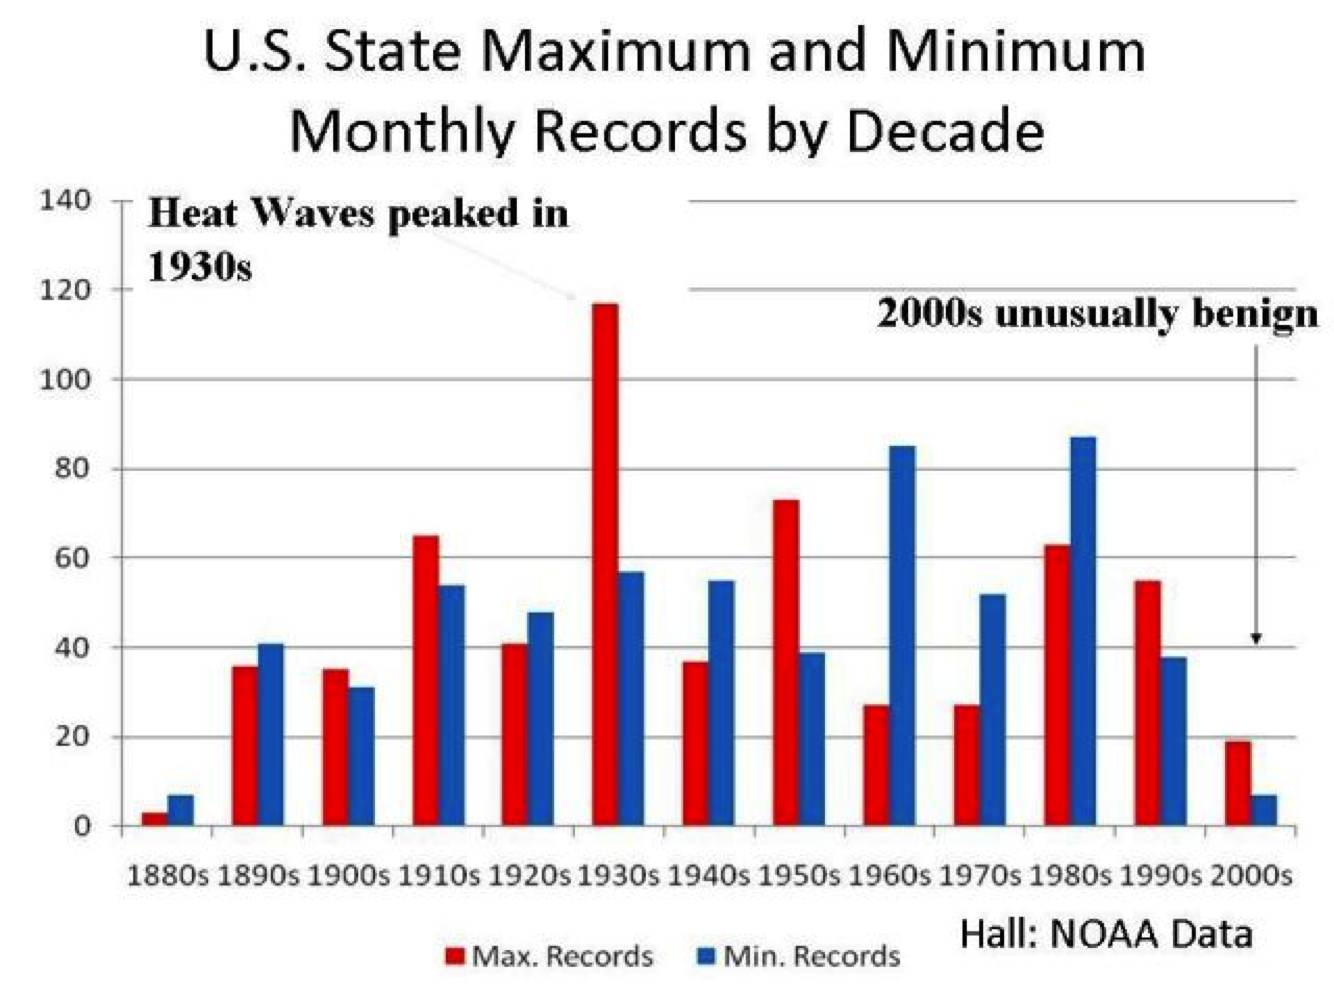
During the 1930s drought, the persistent dryness in the south central built the central heat ridge further and further north eventually setting all time records in many states.
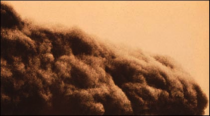

Technically, the driest region of the Plains - southeastern Colorado, southwest Kansas and the panhandles of Oklahoma and Texas - became known as the Dust Bowl, and many dust storms started there. But the entire region, and eventually the entire country, was affected.
Enlarged
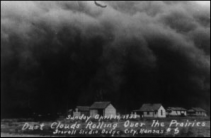
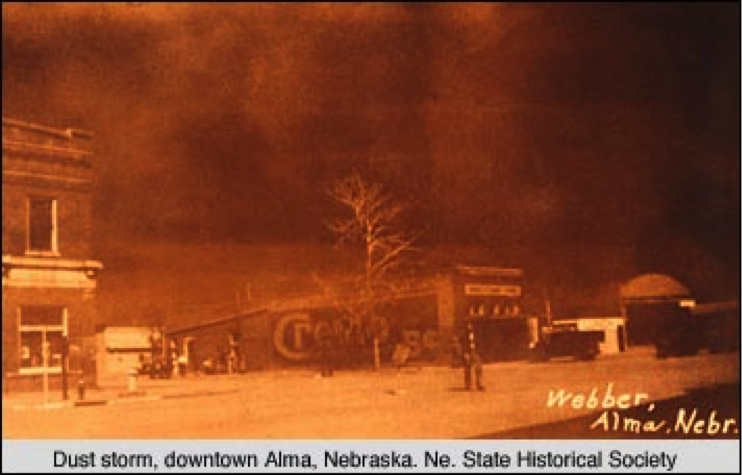
The Dust Bowl got its name after Black Sunday, April 14, 1935. More and more dust storms had been blowing up in the years leading up to that day. In 1932, 14 dust storms were recorded on the Plains. In 1933, there were 38 storms. By 1934, it was estimated that 100 million acres of farmland had lost all or most of the topsoil to the winds. By April 1935, there had been weeks of dust storms, but the cloud that appeared on the horizon that Sunday, the 14th, was the worst. Winds were clocked at 60 mph. Day became night.

Enlarged
The day after Black Sunday, an Associated Press reporter used the term “Dust Bowl” for the first time. In the central and northern plains, dust was everywhere. The dust bowl was caused not just by the dry weather but also by unwise farming practices. Earlier settlers plowed under the natural tall grasses that covered the plains and planted crops they had planted in the wetter East. When the drought came, the crops failed, the ground was uncovered and the incessant winds produced the dust storm. After the dust bowl, farmers ended over-cropping, over-grazing and improper farm methods. Since then wheat which is tolerant of drier conditions was grown in the semiarid west and other crops further east.
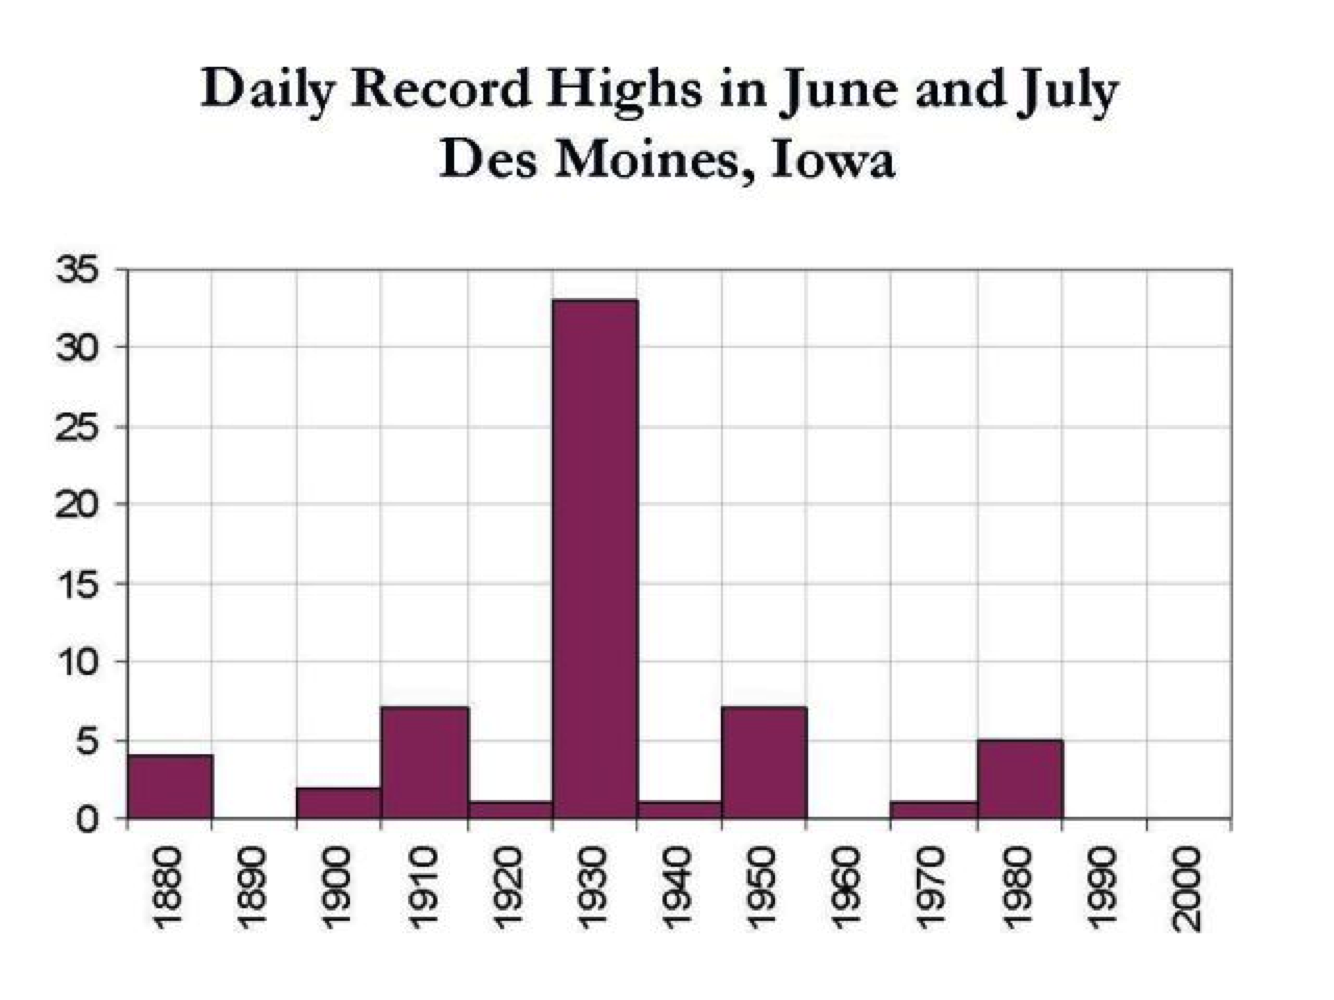
Dry ground enhances heat. Heat can expand north and east (sometimes even west). This can be clearly seen in the plot of record highs for Des Moines, Iowa for June and July. Note 33 of the records were in the 1930s and interestingly none since 1988 until this year when 2 or 3 were tied or set. With the heat ridge nearby, until it rains, more records could fall. We will update this chart in September when we look back on the summer sizzle. The 1930s will still dominate.
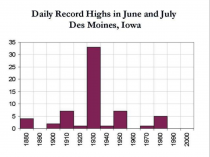
Enlarged
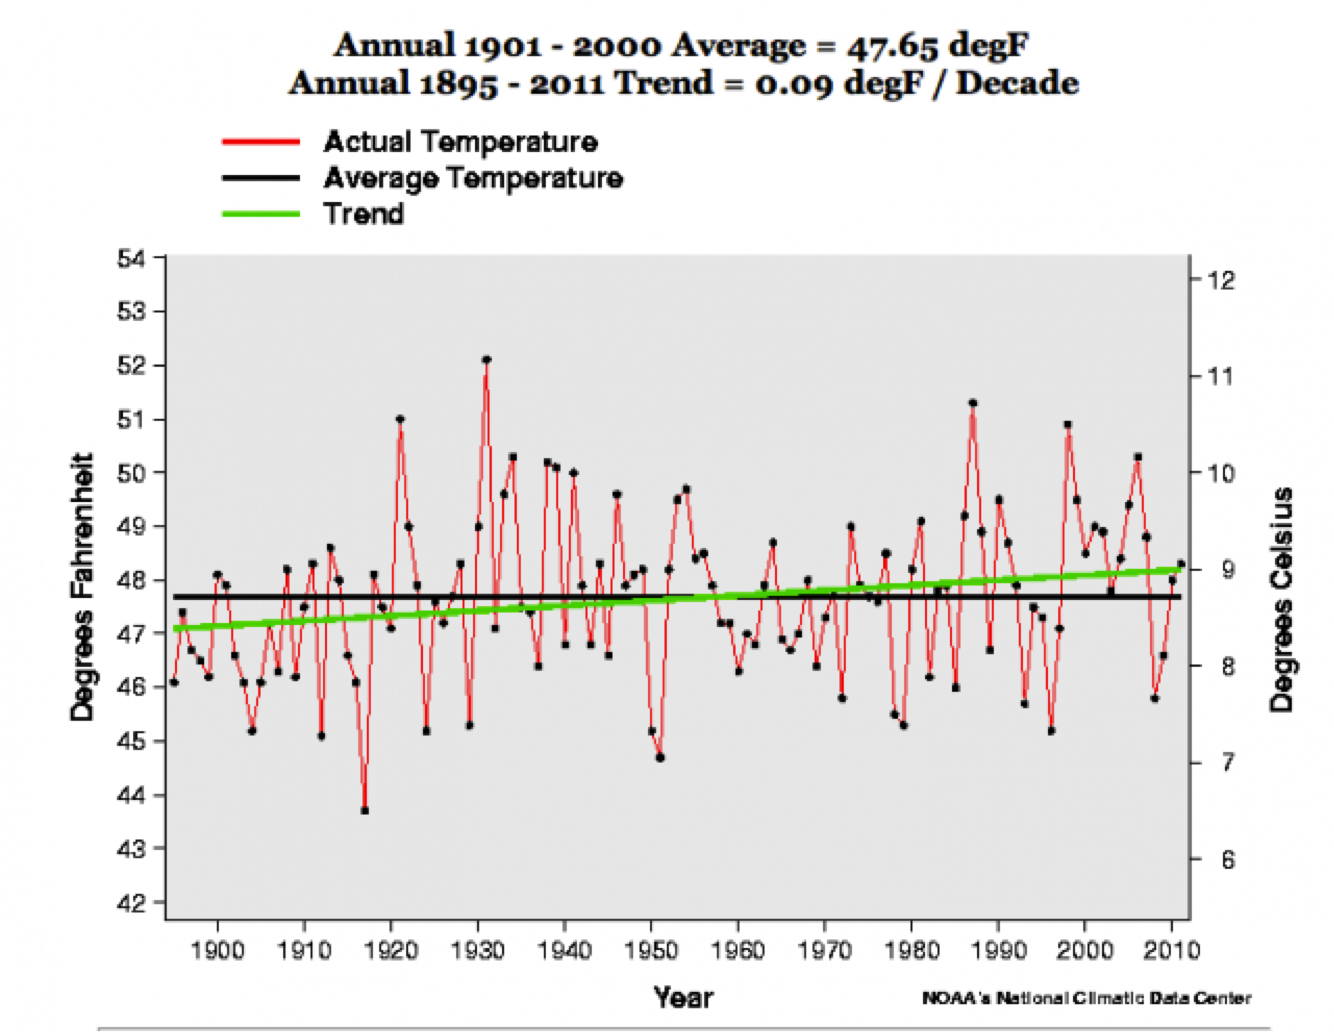
The Iowa first six months of 2012 was the warmest, a touch ahead of 1988 and 1921.
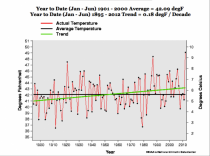
The annual trend is less by a factor of two. We can see the 60 year cycle. We also note, urbanization and land use changes are not adjusted for.
Enlarged
Missouri is ground zero this year and they are similar. First in the January to June averages. the second the annual.

Enlarged
In the annual the 1930s to 1950 dominated with warmth. The positive trend comes from the cold years at the start, the relative secondary max at the end of the record.
Enlarged
Indeed if you go back 100 years, the trend is 0.00F/decade for annual temperatures in Missouri.
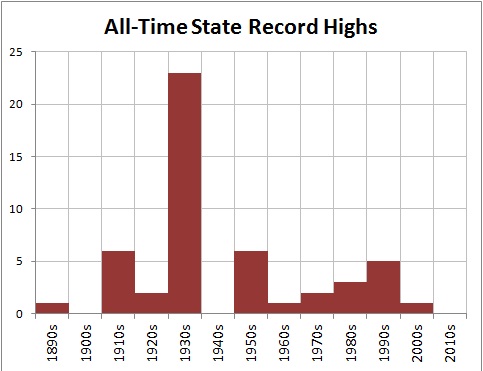
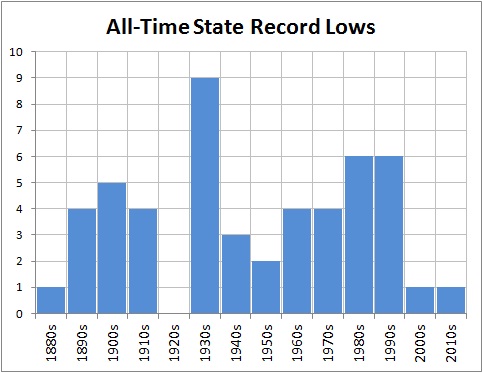
This is true actually for all the states. The 1930s show the most state all-time record highs than any other decade, the 1950s second. The cold records actually peaked in the 1980s and 1960s.


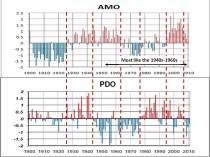
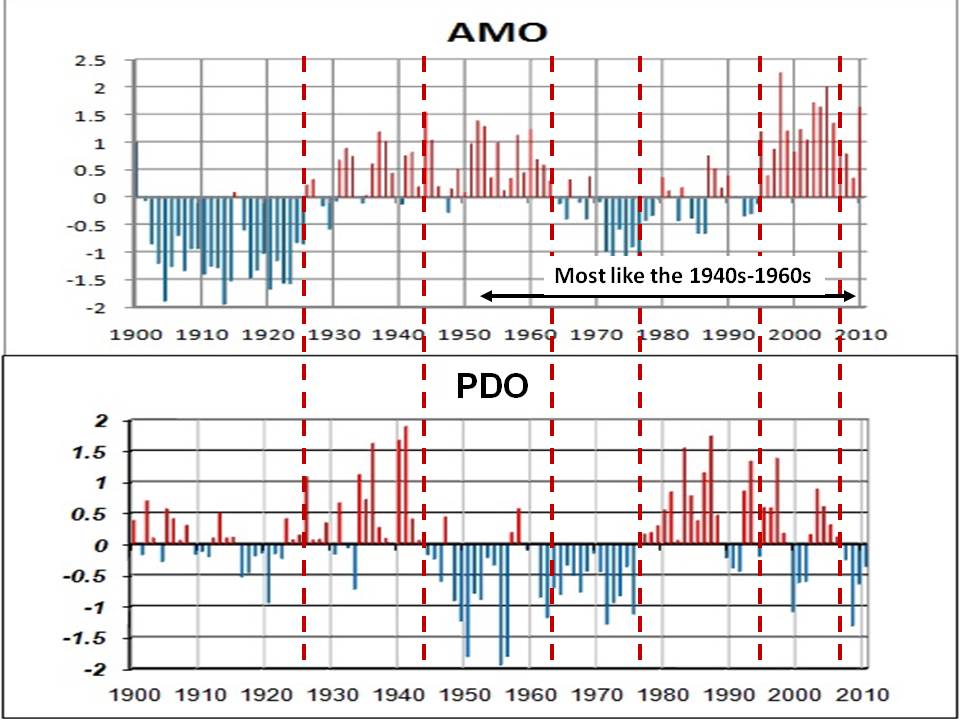
The warmest, droughtiest decades are those with a warm Atlantic (+AMO). The 1930s had a warm Pacific (+PDO) with one important exception 1934. The 1950s like the last three years have had a cold Pacific (- PDO).
The importance of the AMO to drought 9and thus heat) was shown by McCabe (2004):

Drought frequencies are highest (reds) in the AMO states (two right maps). The PDO determines the region. We are bottom right this year.
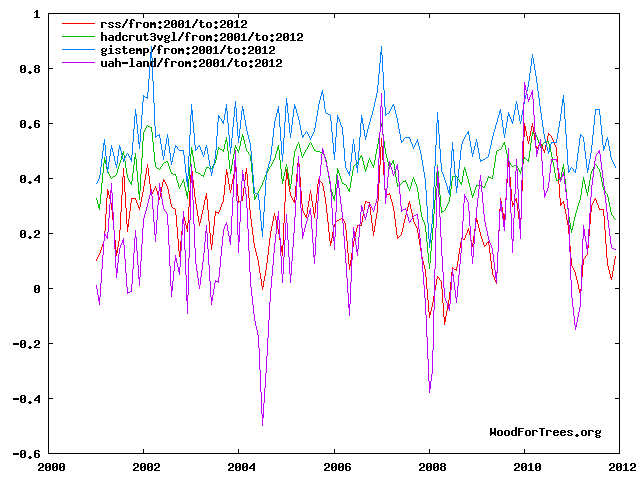
One last chart...the US is only a small part of the earth’s surface (less than 2%). There has been no warming for over a dozen years.
