By Joseph D’Aleo, CCM
A while ago, we presented correlations of US annual mean temperatures with carbon dioxide, solar irradiance, and ocean multidecadal cycles. We found the best correlations with the ocean cycles and irradiance and weakest with carbon dioxide, especially in the last decade.
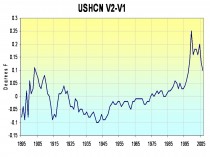
NCDC has released its new climate data set Version 2 of USHCN in which it has replaced some of the prior adjustments (like Karl’s 1988 based urban adjustment) with an adjustment using an algorithm that is designed to find known and previously undocumented inhomogenteities (i.e. station moves, land use changes, etc.). The differences between the two data sets is relatively small but the pattern is hard to understand from a purely scientific basis. The biggest warming is post 2000 which has the effect of elevating recent years relative to the 1930s. It also warms the temperatures in the early 1900s which has the effect of diminishing the warming trend then.

The difference between version 1 and version 2 of NCDC USHCN Annual Mean Temperatures for the US. Full size image here.
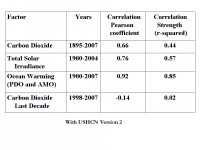
I repeated the correlation analysis with the new data. Again the oceans came out on top followed by the solar irradiance. The new data set had a higher correlation for CO2 for the entire record but when we look at the correlation of CO2 in the last decade it was actually even lower - a small negative.

Correlations of the CO2, solar irrradiance and ocean multidecadal cycles with USHCN version 2 temperatures. Full size image here.
See the detailed analysis here. See Anthony Watts’s take on these conclusions in his Warming Trend: PDO And Solar Correlate Better Than CO2


