By Steve McIntyre, Climate Audit
For anyone who’s betting that 2008 meltback will exceed 2007 meltback, I think that you’ll be able to pretty much know where you stand by the end of this week and your chances are not looking good right now based on this week’s exit polls. Another Climate Audit first.
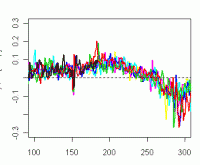
The plot below shows the daily meltback for the last 5 years. 2007 is in red, 2008 in black. Notice the surge in 2007 at the end of June and beginning of July. We’re at julian day 182 today - July 2, 2008.

Daily melt (in million sq km). Negative numbers represent ice growth. See larger graph here
The most intense melt occurred last year between day 179 (June 29) and day 184 (July 4) with 160,000 sq km meltback on day 182 (July 2) and over 200,000 sq km on day 183 (July 3). This year is a leap year, so that July 2 is already day 182 and was only 90,000 sq km. As of yesterday, 2008 was about 510,000 sq km behind 2007 and it looks like it is losing ground day by day in the first week of July - a big melt week where it has to make time. Read more here.
Icecap Note: Steve promises more updates on Climate Audit this important week. See the side by side ice coverage from the University of Illinois Cryosphere site last year and this year (a leap year so a day earlier) here. And see the daily anomaly plot here.
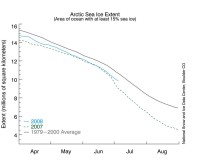
See the NSIDC plot here as we fall behind 2007.

See larger graph here
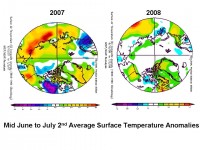
Note last summer was characterized by an anomalous warm blocking high pressure on the Siberian coast. This year, there has been a cold polar trough migrating around the Arctic basin. Notice the difference in surface temperatures. Some of this offshore difference of course is due to open water last year that is still frozen this year.

Arctic surface temperature anomalies Mid-June to July 2, 2007 vs 2008). See larger graphic here


