


By Steven Goddard
We are constantly being told that 2010 is the hottest year ever, and that the polar ice caps are melting down at a record rate. Dr. Hansen tells us to expect 3-6+ metres of sea level rise this century. That would be a minimum of 30 mm/year.

Low tide in Brittany
Given Dr. Hansen’s record heat, the oceans must be heating and expanding, and the polar ice sheets must be melting and pouring into the sea. Sea level must be rising like crazy!
Hansen’s completely bogus graph shows Greenland blowing away their previous record high annual temperature. They must be having a flood of melting ice up there.
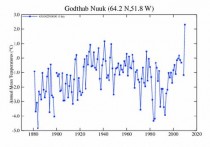
Someone at GISS appears to have a sense of humour. The graph above (enlarged here) shows annual average temperatures (not anomalies) for the capital of Greenland. It looks like 2010 is by far the warmest year on record.
Most people displaying this type of information would be sensible enough to wait until the end of the year to calculate an annual mean. Obviously the January-August mean temperature is going to be much higher than the January-December mean. The 2010 data point should not appear on the graph until 2010 is over.
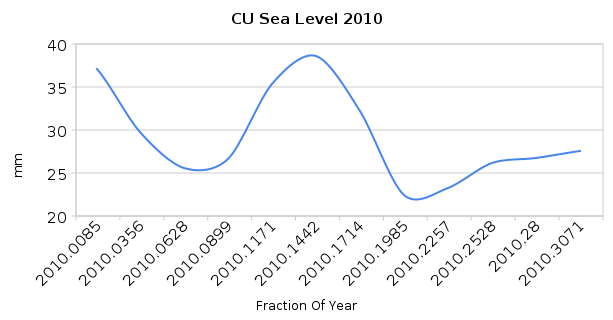
Only problem is, since the start of the hottest year ever, sea level has fallen 10 mm. The most recent data from The University Of Colorado is shown below (enlarged here).
We can conclude that the oceans are neither heating nor are the polar ice caps melting at a rapid rate. As usual, Hansen’s theory does not match observations on the ground.
Hansen is so last millenium. He already used up all of his best temperature adjustments and is running out of time to get some real warming going.
See posts here.
ICECAP NOTE: We should expect a rise this year in Greenland temperature with the record negative Arctic Oscillation. We also note that the sea level data is through a third of the year. There are often more than one peak in a year and the big one is often the second half.

(sea levels every 10 days - mm)
Note also there has been some pop up since 2009 as the oceans warmed with El Nino. A good part of sea level rise in warmer years is thermal expansion. Note the leveling off during the La Nina of 2007-2009 when the oceans cooled and contracted. For the same reason that Hansen should not be reporting on 2010 with less than 2/3rds of the data, we can’t yet make a call about 2010 sea level until it is over. I am sure Steve will update us then.