World Climate Report
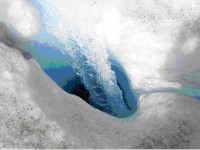
No self-respecting global warming presenter would ever miss the chance to warn the audience that higher temperatures could melt ice in places like Greenland, the melting water could lubricate the interface between ice and rock, and watch-out, the ice could increase its velocity, fall or move quickly into the sea, and cause a rapid rise in sea level. If you happen to be Al Gore, you might show us melting ice, water pouring into some moulin (Figure 1), and then cap it off with an image of water drowning out the World Trade Center Memorial. This story in its near infinite varieties appears on literally thousands of websites dealing with the global warming issue.

Figure 1. A moulin is typically a narrow tubular chute through which water enters a glacier from the surface. Moulins can go all the way to the bottom of the glacier, and the water from moulins may help lubricate the base of the glacier, and according to Gore and others, this could accelerate the movement of the ice.
A recent article in the prestigious Science magazine has an alarming title that should thrill the greenhouse crusade: “Large and Rapid Melt-Induced Velocity Changes in the Ablation Zone of the Greenland Ice Sheet.” Holy cow - it’s just like Gore warned us. However, once we dove into this article, we found an amazing twist given the threatening title, and we could not wait to feature the piece on World Climate Report.
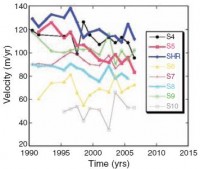
Probably the largest surprise in the article can be seen in the Figure 3 in which we can see the velocity changes at many sites over the 17-year period. The authors note that “The overall picture obtained by averaging all stake measurements at all sites for individual years indicates a small but significant (r=0.79, P < 0.05) decrease of 10% in the annual average velocity over 17 years". Despite all the talk about moulins, melting, rapid acceleration of ice, van der Wal et al. reveal that the ice movement in western Greenland over the past 17 years has slowed significantly!

Figure 3. Variations in annual velocity along the K-transect over 17 years; sites with a significant decrease over time are depicted as thick lines (from van de Wal et al., 2008).
See full size images and read much more here.


