


Pajamas Media
The data underlying the famous “hockey stick” global warming graph has finally been found after having earlier been misplaced by leading climate researchers. The newly recovered data confirms the accuracy of the abrupt upward turn in readings characteristic of the “hockey stick” shape found in many global warming projections.
Up until now, however, the data on which the controversial graph had been based was presumed to be lost, so it was not known exactly which aspects of global warming the chart illustrated. Now that the data has been recovered, scientists can state with complete certainty that this updated chart accurately chronicles the past and future trajectory of the global warming crisis.
View the full-size graph by clicking HERE or on the small version shown below:
-------------------------
Snowicane - Major Storm Clobbers Northeast
By Joseph D’Aleo
A major nor’easter with hurricane force winds, mountainous snowfalls, flooding rains has slammed the northeast leaving at least 700,000 homes and businesses without electricity. Power failures were so bad in New Hampshire that even the state Emergency Operations Center was operating on a generator. Meanwhile in this upside down storm, it was rain and hurricane force winds in eastern New England with a wind gust of 91 mph at Isle of Shoals near Portsmouth, New Hamsphire and 94 mph at Cape Elizabeth, ME, well above hurricane force of 74 mph. Gusts hit 60 mph or more from New York’s Long Island to Massachusetts.
Public Service of New Hampshire, the state’s largest utility, reported power cut to at least 237,000 homes and businesses and said it would take days before everyone’s lights flickered back on. New York had more than 220,000 customers without power, mostly in the Hudson Valley north of New York City. Maine reported 130,000, Massachusetts 100,000, Vermont 25,000 and New Jersey 11,000.
New York City’s Central Park has had 20.9 inches as of 7 pm Friday, the fourth greatest for any storm in New York City since 1869. It is a new record monthly snow FOR ANY MONTH with 36.9 inches breaking the old record of 30.5 in March 1896.

But up in the Catskills, they hit the jackpot with a 5-day total of 84 inches at Hunter Mountain and 60 inches at Windham. Here is this Friday’s newsletter email from Hunter Mountain.
Good morning from Hunter Mountain!!
We wanted to let you know that we’ve received 60” of snow (they added at least 5 during Friday) in the last 3 days… and we wanted to invite you to come up and shoot some photos, film, or just to see this crazy snow for yourself!
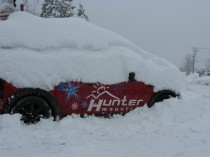
We watched the weather report this morning, and they reported a mere 30” total in Greene County—it made us laugh. There’s more than 5 feet of snow in Hunter, with roadside snowbanks 10-12 feet high.
It’s still snowing here, albeit lightly… but we’re expected to get another 4-8” today as the storm winds its way back and hits us again!
If you’d like to come up, or if you’d like more info on the “Snowicane” of 2010, hit me up! We can certainly make arrangements for you. This is epic snow that has not been present in the area since the 30’s and 50’s—come up and take a bit ol’ bite of snowstorm history here, folks! We’ve had hundreds of die-hard skiers and riders here to ski and ride through this storm!
We hope you’ll consider taking a ride up here… the snow has calmed a bit, the roads are in good shape. For up-to-date info on our operations, visit the Hunterblog. Check our Photo Gallery for some photos from the past few days… our webcams are running as well (we’re working on digging out the summit cam...). As we’ve been telling our fans & followers… come get some!!
See the Bloomberg story on the new monthly record here.
From New York to northern New England Mountains, near or more than 4 feet of snow fell. Sunday, River, Sugarloaf in ME, Stove in VT over 50 inches so far. Another foot or more coming tomorrow in a wrap around storm.
--------------------------
Depth of two-day snowfall remains blanketed in mystery
By By Frank D. Roylance, Baltimore Sun
The blizzard that heaped more than 2 feet of snow on Baltimore on Feb. 5 and 6 was probably the deepest two-day snowfall on record. But we might never be sure how deep it was.
A contractor working for the Federal Aviation Administration at BWI Thurgood Marshall Airport, paid to measure the snow for the aviation industry’s needs, did not follow a separate protocol required by the National Weather Service and the National Climatic Data Center for valid climate data.
So while the contractor measured 28.8 inches of snow during that storm, the National Weather Service has thrown out the reading. Instead, climatologists will rank the storm as “only” 24.8 inches - a number that almost surely understates the “true” total.
Worse, for climatologists, it now appears the weather service’s rules for snow data had been ignored for years at BWI, throwing a cloud over the validity of snow totals as far back as 1998, when the FAA took the job over from the weather service.
Only BWI’s data are known to be affected, but the problem could be more widespread. That possibility has caught the attention of top officials at the FAA.
“We plan to meet with the National Weather Service next week to begin a discussion on making sure that we’re all on the same page in terms of measuring snow accumulations at our airports,” FAA spokesman Jim Peters said. “There will be a national discussion.”
In the meantime, the weather service’s Baltimore- Washington Forecast Office in Sterling, Va., is preparing to convene a committee of climatologists and other experts to review Baltimore’s snowfall records from the 2010 and 2003 storms, and perhaps back to 1998.
“I feel very strongly about historical records and getting the climate data correct,” said James E. Lee, the meteorologist-in-charge at Sterling. “Obviously, with the increased media attention and political attention to climate, it is really up to NOAA [the National Oceanic and Atmospheric Administration, of which the National Weather Service is an agency] to make sure ... the climate record is a genuine one, and consistent to the best of our ability.”
The problem at BWI came to light Feb. 6, as snow accumulations reported at the airport passed 26 inches. They seemed poised to break the record set in February 2003 - the storm listed on Sterling’s Web site as Baltimore’s biggest.
But when reporters called asking about a new record, Lee said that because of measurement errors by an FAA contractor at BWI, the two-day storm total would be pegged at “only” 24.8 inches. He had discarded a 28.8-inch measurement from BWI because it was the sum of hourly measurements throughout the storm - a method invalid for climatological data.
Even at 24.8 inches, Lee said, the storm total beat the previous two-day record of 24.4 inches, set at BWI during two days of the four-day 2003 event. “I’m convinced that was the most amount of snow Baltimore has seen [from a two-day storm] in recorded history.”
But Lee had to use the most conservative reading from the airport - a “snow depth” measurement of the total on the ground when the storm ended, after hours of compaction.
The FAA requires its observers to take hourly snow measurements and wipe the boards clean after each hour, adding the totals as they go. That provides pilots with better real-time information about changing conditions. But it virtually eliminates compaction and so inflates accumulation. Climatologists require measurements every six hours, striking a balance between the hourly and snow depth readings. Some airports maintain separate snow boards for the different protocols. But not BWI.
Richard Carlson, vice president of Pacific Weather Inc., said his company has experienced weather observers at 20 U.S. airports, including eight at BWI. Pacific has held the contract there since 2008.
“We follow the FAA manual ... and that is the guide book on how these meteorological observations are to be taken,” Carlson said. “We had heard about the six-hour measuring thing, but ... if you have high winds at all, this really is not going to work.”
So when Lee questioned the snow data from BWI on Feb. 6, Carlson said, “we informed them [Lee] that we have different criteria, a different manual we are following.” He says the company’s predecessor at BWI also followed FAA rules.
Lee “kept harping back to the six-hour measurement thing,” Carlson said. “That’s meant for climatological purposes, and what we’re doing is operational,” serving the needs of the airport. “He wasn’t real happy.”
Lee wasn’t happy, but there was little he could do. “It’s interesting to have the responsibility for quality control but not the authority to tell the [FAA] contractor what to do,” Lee said.
“In future inspections, this will be raised ... prior to the start of the winter season, to ensure the six-hour swipe is going to be adhered to,” he said.

Shawn Durkin, weather station manager who has worked for Pacific Weather Inc. for 16 years, stands on the rooftop location at BWI where Pacific Weather takes its snow measurements, using a snow board, mounted on the bench to his left, and an 8-inch rain gauge, at right
Read full story here.