By Joseph D’Aleo, CCM, AMS Fellow
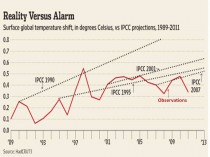
The 2010 as expected caused a global spike in temperatures. The subsequent La Nina caused a cooling. The stasis is going on a decade. Even Phil Jones admitted little significant change since 1998 (and a cooling of 0.12C from 2002-2009).
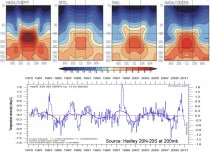
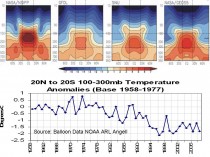
The greenhouse models as shown in the top of the following graphs forecast the greatest global warming high up in the tropics where the greenhouse gas ‘heat trapping’ and condensation from enhanced convection and increased moisture is greatest. Notice however in this hart how weather ballooons don’t see the warming at that level. The data here is NOAA ARL data from Angell. Other radiosonde compilations such as RICH show less cooling but no warming.
Enlarged.
The Hadley 20N-20S data compilation in the same tropical belt (20N-20S) at 200mb show also no warming (actually a slight cooling) in over three decades.
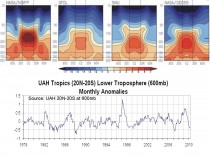
The University of Alabama MSU satellite data is optimized lower down at 600mb. See how they show little change in the 32 years.
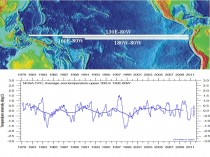
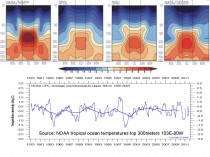
The oceans are modelled to warm significantly due to greenhouse gases with increased heat content. Buoys provide a very good depiction of ocean temperature profiles (not contaminated by factors like urbanization). The average temperature of the sea in the belt from 5N to 5S and through the depth of 300m shows a slight not statistically significant cooling since 1979.
Again see how that matches up with model forecasts here.
This is another series of facts that call into serious question the greenhouse models and theory. See story here.


