By VJones, Digging in the Clay
Congressman Johnson may be concerned about the increasing population on Guam causing the island to tip over, but has population increase had interesting consequences for one of the island’s weather stations?

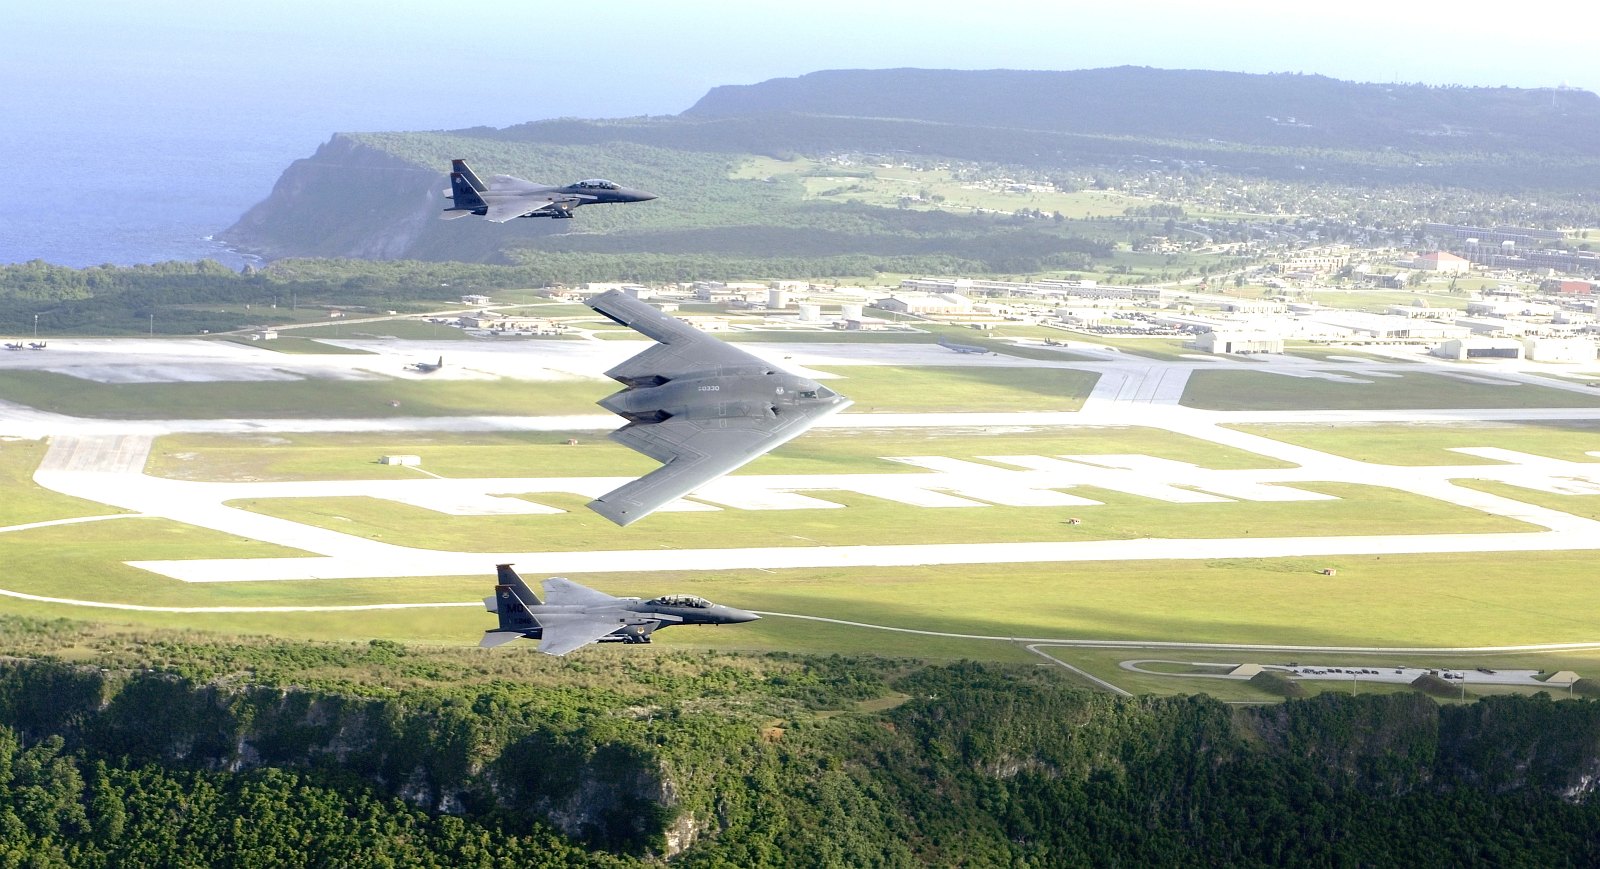
Andersen Airforce Base, Guam (original here)
There are three stations for Guam in the GHCN data file: Andersen AFB; NWSO Agana and WSMO Agana. For such a small island three weather stations, all in similar topography on the northern part of the island, would be expected to show very good correlation, after all they are within 10 miles of each other, but one shows a very large and sudden warming during the 1990s.
These are the stations from GISS Station Data:
NWSO Agana, G 13.5N 144.8E (WMO id 91212) Rural area 1921 - 2010
WSMO Agana, G 13.6N 144.8E (WMO id 91217) Rural area 1956 - 2004
Andersen AFB, 13.6N 144.9E (WMO id 91218) Rural area 1949 - 1981

As these are all classified as rural stations, they are not adjusted. NWSO Agana is located at the busy international airport, seen in the picture above just inland from the capital, Hagatna, at night. Andersen Airforce Base is in the northeast of the island, but WSMO Agana was hard to find initially due to the very approximate latitudes and longitudes in the GISS station data.
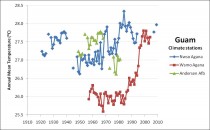
Here is what the three temperature records look like when plotted together (below, enlarged here):
For Andersen AFB and NWSO Agana there are variations of just over a degree, and there is obviously a discrepancy between them in how the local topography responds to climate. Also, these are airports so there may be human influences there. However, that is one hell of a rise in WSMO Agana. How can you get that much warming at one of three such close stations in such a short period? Did no-one notice? I thought a lot of the checking that is done of the climate record is supposed to pick up and throw out “outliers”? OK, perhaps that is just the odd month or the odd year. This has intrigued me for a while. That cannot be normal and it certainly isn’t caused by CO2. Time to do some digging…
VJones looks at the 3 stations in some detail in the post. She continues:
NCDC site - the end date for WSMO Agana: 2nd April 1998. NCDC concurs. Quick - scroll back up to that graph again. Yup - data for WSMO Agana up to 2004. How can this be? FILLED in DATA?
Now the WWRC also had data for these three stations, although it said “last updated 2006”. There was a good fit with what I had pulled off the GISS site (at the end of November) - the data originating in the NCDC GHCN data file. I just plotted what I found and there are minor discrepancies granted, but it is the gaps I was interested in (image here).
In the Western Region Climate Center (WRCC) data, Andersen AFB continues reporting until 2002, with rising temperatures; WMSO Agana stops reporting in 1997 (as it should); there is no gap for NWSO Agana, but that fits reasonably closely with the post-1997 WMSO Agana data. So in the GHCN/GISS data NWSO Agana stops reporting for a while, but the data seems to be spliced into another station. Interesting. So what? Well the implications only become clear when you realise what this does to the temperature anomalies. The following graph (enlarged here) shows the effect:
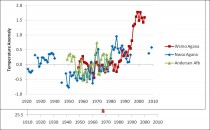
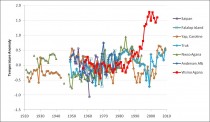
Look at that hockey stick - wow! This gives a sustained 1.5 degree anomaly for Guam for nearly a decade. See in the post here how it affects numerous grid boxes used to compute global anomalies. See here also how it stands out as an outlier with respect to other stations in the region. Note that Koror (Palau) and Truk (Chuuk) are over a 1000km from Guam. WSMO Agana still sticks up like a sore thumb.