


By Joseph D’Aleo, CCM, WeatherBell Analytics
The Mississippi River Basin is the third largest drainage basin in the world. It drains an area of 1,245,000 square miles, including all or part of 31 states and two Canadian provinces. The Mississippi River is vital to mid-continent transportation and supplies water for drinking, irrigation, and industries. Major floods on the Mississippi River have caused billions of dollars in property damage.
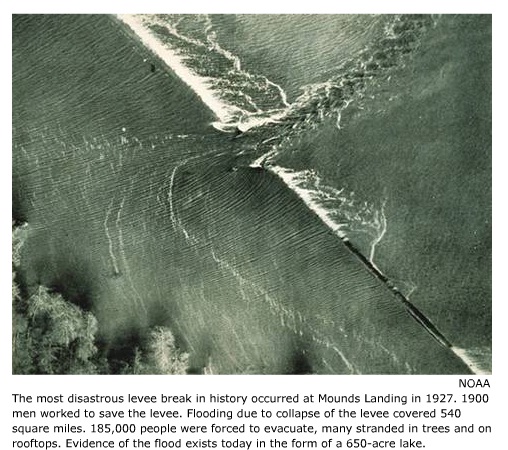
The Great Flood of 1927 did the equivalent of over 5 billion dollars (at current value). It was one of the most powerful natural disasters of the 1900s. Following several months of unusually heavy rain during late 1926 and early 1927, the Mississippi River flooded. During the height of the flood, the river was over 80 miles wide at some locations.
After the failure of a levee at Mounds Landing, Mississippi, the flooding river flowed with the force of Niagara Falls.

The levee failure eventually resulted in the flooding of an area the size of Connecticut. Ten feet of water covered towns up to 60 miles away from the river. Even after 5 weeks, the area around Mounds Landing was covered with 100 feet of water.
In the end, the Flood of 1927 affected an area of 27,000 square miles, about the size of all the New England states combined. Over 130,000 homes were lost and 700,000 people were displaced. 246 flood-related deaths were reported.
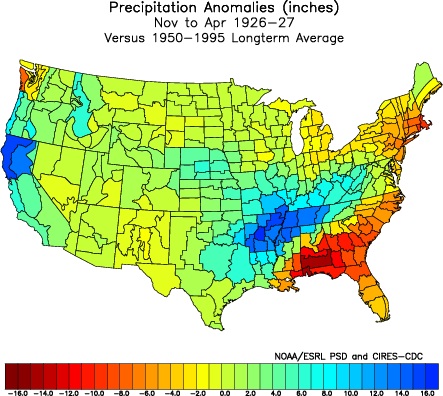
The rains that year actually began falling in late 1926 and continued into the spring. The November to April anomaly map looked like this.
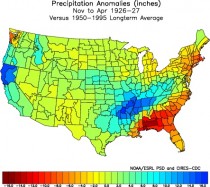
Note the greatest anomalies (up to 16 inches) were right over the northern Delta region - the mid Mississippi and Tennessee Valleys.
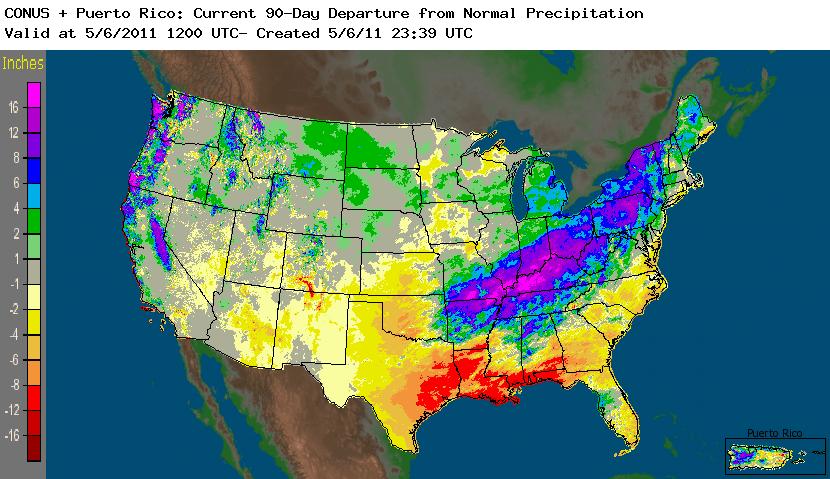
This years the rains really picked up in the spring. The last 90 days is when the bulk of the heavy rains fell. Ironically some of the area most affected by flooding along the southern Mississippi Valley has large (over 8 inch) negative rainfall anomalies.

The heaviest rains this year occurred from the Mid Mississippi Valley northeast right along the Ohio River which feeds the Mississippi.
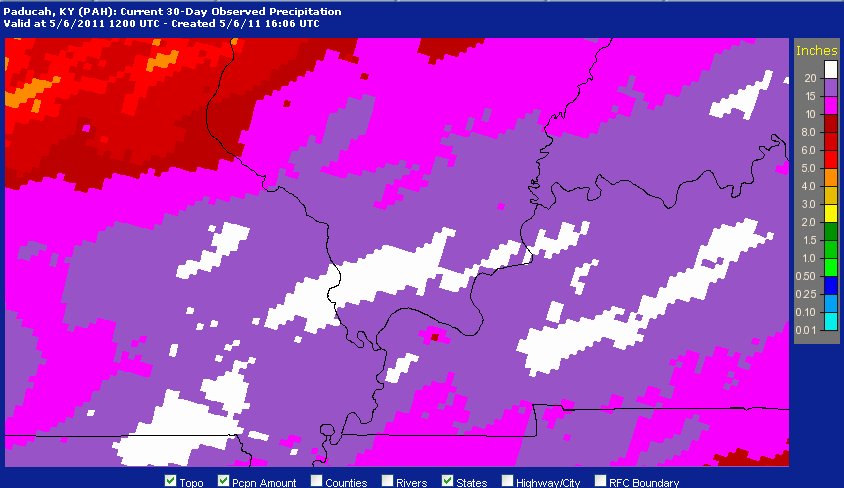
The National Weather Service in Paducah, Kentucky showed this map of rainfall from April 6 to May 6, 2011:
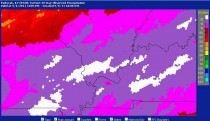
Most areas got 400 to 500% of normal. See a report on the rainfall and severe weather in that region here.
That is what is making 2011’s flood potentially the worst on record in terms of total area affected and impact. See some amazing photographs of the flood from the ground and aerial including the intentional break of the Birds Point levee and the 130,000 acres of flooded farmland here.
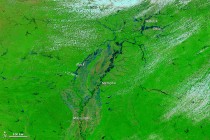
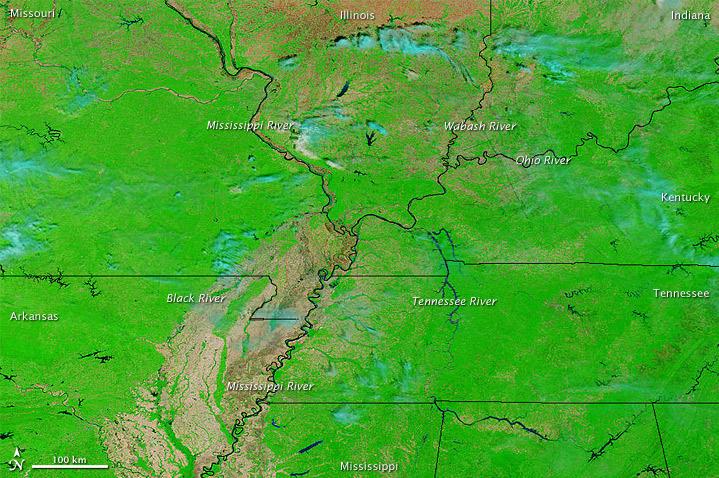
Here is a picture from space by NASA of the swollen rivers.
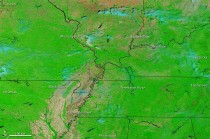
Compared to 2010 on the same date.
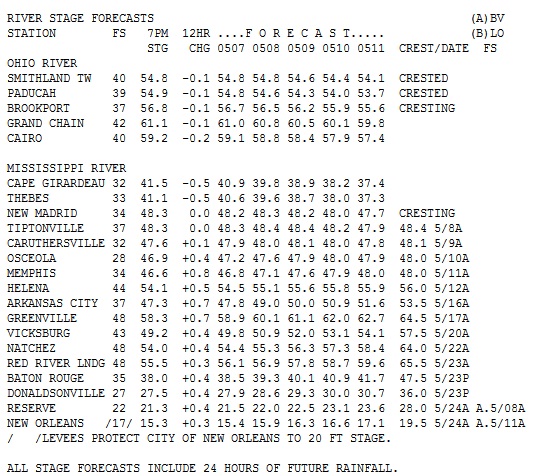
The River Forecast Center in Slidell, LA has this outlook for the gauge locations along the Ohio and Mississippi River. Some locations have crested. Others downstream will see crests as late as May 24th. Notice has much above flood stage (first column) the river gauge locations are forecast to be. Osceola is expected a crest 20 feet above flood stage (currently they are 18.9 feet above).
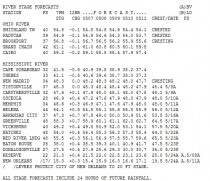
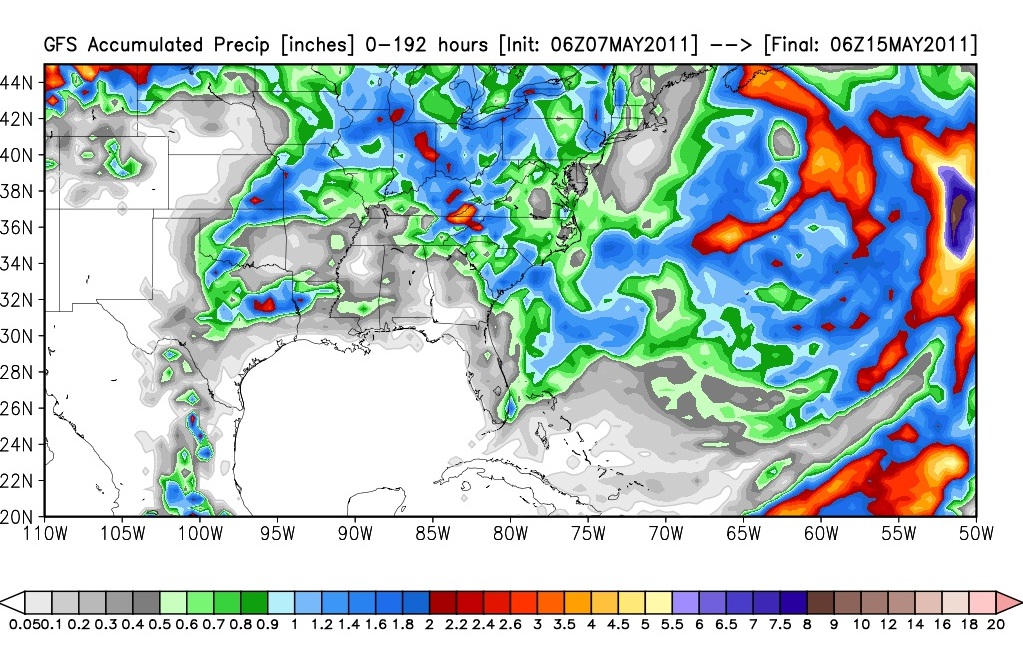
Fortunately the pattern has changed with the action shifting further north. The flooded region will not get excessive rainfall and runoff to further enhance this flood crest the next 8 days.
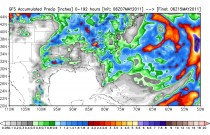
Indications are the action stays there week 2. Flooding more localized is likely to increase in the eastern Ohio Valley and the northern Appalachians in NY and PA, where they have been very wet this spring. (Ironically in October and early November in 1927, extreme flooding followed the Mississippi flooding in New England focused on Vermont.)
The rains are increasing north and east of the flood area as we have noted together with snowmelt is already causing significant flooding. See Meteorologist Bill Steffen’s WOOD-TV post here on the lake level rises in the Great Lakes and Champlain Valley.
Of course the Ohio River and its tributaries feed the Mississippi and runoff into the Ohio River will slow the decline of river levels and produce a much smaller, secondary crest that runs down the river system at some point as the rains continue.
A large section of Mississippi River is closed for barge traffic. The latest river forecast would keep the river closed for 8 days at Caruthersville, Missouri, with other closures possible as the water flows south to the Gulf. The Mississippi is a key transportation route for 500 million tons of cargo each year - including chemicals, coal, oil, timber, iron, steel and more than half of the nation’s grain exports.
The Port of New Orleans is America’s gateway to the global market. New Orleans has been a center for international trade since 1718 when it was founded by the French. Katrina disrupted transport for many weeks in 2005.
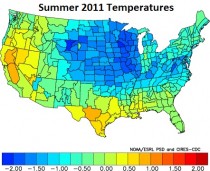
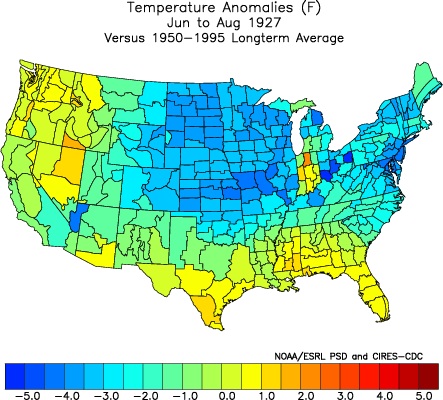
One final addendum. See the summer temperature pattern in 1927, not unlike our view of this summer. The anomaly in Indiana is likely a bad data point.
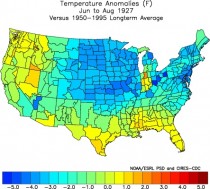
It also fits the soil moisture based model that uses current soil moisture and past weather that followed similar conditions. 1 STD in ORD would be -2.1F. It approaches 1.8 STD near St. Louis.
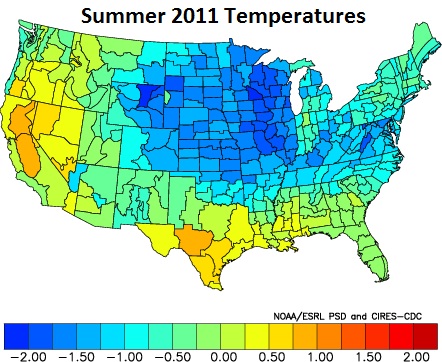
It fits our analog summers (June through August).
See this and much more on WeatherBell Analytics, still free blog here.