


By Dr. Anthony Lupo
Early in 2010, all signs pointed toward a warmer summer in the middle Mississippi region [1], and this would be related to the weakening El Nino [2],[3]. The forecast, however, did not go far enough because we did not anticipate how quickly La Nina conditions would take hold [4]. When asked about the possibility of a warm summer, I reminded people that the last few summers have been relatively cool, so even a normal summer may seem warm.
As the summer moves into late August, I have heard many in the media and in the local general public wonder aloud about this summer being the consequences of anthropogenic global warming, and that this summer has been the hottest in recent decades [5]. Putting this summer into context locally* would demonstrate that while it is the hottest summer of the decade, and the warmest since 1980, it is only the 11th warmest overall in 120 years. Of the ten warmest summers nine of them occurred before 1960. Summers as of late have been cooler in our region.
While the years 2005-2007 were warmer than normal, these summers did not rank in among the top 20 for our region. This current summer follows a stretch of summers that have been cooler overall as four of the last eight have been below normal, some of these by quite a bit. The summer of 2004 and 2009 ranked as the 3rd and 9th coolest overall in our region, respectively.
Adding to the woes of this summer locally have been the relatively high dew points brought on by excessive precipitation in our region in the early part of the summer. Additionally, it has not been the maximum temperatures that have been the problem (we have failed to reach 100 degrees for the third consecutive year), it has been the consistently high minimum temperatures. While it is too early to tell what has happened nationwide, my guess is the story is much the same in other regions as well.
Globally, we have heard about the heat in Russia and the Middle East, and flooding in Pakistan. While this may seem like it is a consequence of climate change, this summer season is not unlike another recent summer, that of 2003. That year, it was warm summer that followed the relatively cold winter of 2002-2003. That year, like this one followed a weak El Nino event.
This El Nino that was different from others in that main sea surface temperature anomaly was located over the central tropical Pacific rather than the over the eastern Tropical Pacific. We [2], [3] have found that these type of weak El Ninos could be associated with colder winters over the eastern USA rather than warmer winters which are routinely forecast to occur. Additionally, we have found that as El Nino transitions back toward La Nina, a warm summer over North America is generally the result [2][3].
In 2003, as a warm summer set in, a strong heat wave also occurred over western Europe and many in France perished. This year, we have seen a repeat of these type of conditions as the Northern Hemisphere has been relatively warm. The excessive heat became established over Russia instead during this summer due to a phenomenon called blocking [6]. Blocking causes large-scale weather patterns to stagnate, and if a ridge is established over a continent during the summer, it will be hot. We have seen this type of activity over Europe in 2003, Alaska in 2004 [7], and now Russia in 2010[8].
Is this really the hottest summer globally? While some have reported that it is [8], an examination of the global weather as a whole would suggest it is not [9]. Lost in much of the noise has been the fact that in the Southern Hemisphere, especially South America, conditions have been much colder during their winter with unprecedented snows in many areas not used to them. There is also some speculation that this summer’s global warmth has been exaggerated by those with an agenda.
So, while this summer has seemed to be miserable compared to the last few, it has been much worse in the past, is due to natural phenomenon (not anthropogenic climate change), and thankfully the heat should be winding down as August wears on and September comes in. Additionally, it is hoped that the Russian heat wave will draw more attention to the weather phenomenon of blocking that is difficult to forecast [6], [7] but largely overlooked.
*Here we used the Columbia, MO temperatures, which are representative of much of central Missouri. The story has been similar elsewhere across the state. These summer temperatures are only complete as of 1 June to August 18.
[2] Lupo, A.R., Kelsey, E.P., D.K. Weitlich, I.I. Mokhov, F.A. Akyuz, Guinan, P.E., J.E. Woolard, 2007: Interannual and interdecadal variability in the predominant Pacific Region SST anomaly patterns and their impact on a local climate. Atmosfera, 20, 171- 196
[3] Lupo, A.R., E. P. Kelsey, D.K. Weitlich, N.A. Davis, and P.S. Market, 2008: Using the Monthly classification of
global SSTs and 500 hPa height anomalies to predict temperature and precipitation regimes one to two seasons in advance for the mid-Mississippi region. Nat. Wea. Dig., 32:1, 11-33
[6] Wiedenmann, J.M., A.R. Lupo, I.I. Mokhov, and E. Tikhonova, 2002: The Climatology of Blocking Anticyc- lones for the Northern and Southern Hemisphere: Block Intensity as a Diagnostic. J. Clim., 15, 3459-3473.
[7] Hussain, A., and A.R. Lupo, 2010: Scale and stability analysis of blocking events from 2002 to 2004: A case study of an unusually persistent blocking event leading to a heat wave in the Gulf of Alaska during August 2004. Advances in Meteorology, in press.
See PDF.
--------------
The Great Russian Heat Wave of 2010
World Climate Report
The longer and deadlier the heat wave in western Russia becomes, the more frequently it is being linked to anthropogenic global warming.
But global warming theory doesn’t come anywhere close to explaining why it’s so darn hot this summer in Moscow.
Long-term observations suggest a more basic cause - an unusual and unprecedented (at least since 1950) confluence of several naturally-occurring atmospheric circulation patterns that together combined to set the stage for extreme warmth. Add to that urbanization, changing forestry practices, and perhaps throw in a dash of global warming for good measure, and you take a situation that would otherwise be “very hot” and up it a notch to “record hot.”
The driving force of the 2010 heat wave has been a stationary weather system that has remained locked in place over western Russia since mid-June. The atmospheric is termed to be “blocked” when atmospheric circulation patterns remained fixed in place, instead of being progressive. The prolonged snow and cold in the eastern half of the U.S. last winter was caused by an atmospheric block which locked in a pattern which allowed arctic air to slide southward and storm systems to track up the east coast. The heat in Russia is caused by a blocking pattern which has locked in high pressure over Moscow and environs which favors southerly (warm) flow, a lot of sunshine, and little rain.
Atmospheric blocking is not unique to today’s climate. It is associated with atmospheric teleconnection patterns, described the National Weather Services Climate Prediction Center (CPC) as “and persistent, large-scale patterns of pressure and circulation anomalies that span vast geographical areas.” The CPC ‘s description continues:
Teleconnection patterns are also referred to as preferred modes of low-frequency (or long time scale) variability. Although these patterns typically last for several weeks to several months, they can sometimes be prominent for several consecutive years, thus reflecting an important part of both the interannual and interdecadal variability of the atmospheric circulation.
All teleconnection patterns are a naturally occurring aspect of our chaotic atmospheric system, and can arise primarily a reflection of internal atmospheric dynamics.
Teleconnection patterns reflect large-scale changes in the atmospheric wave and jet stream patterns, and influence temperature, rainfall, storm tracks, and jet stream location/ intensity over vast areas. Thus, they are often the culprit responsible for abnormal weather patterns occurring simultaneously over seemingly vast distances.
The CPC identifies and monitors about 10 different teleconnection indices, each with specific patterns of atmospheric circulation and associated impacts on surface temperatures and precipitation. The CPC has compiled the history of these teleconnection indices back to January 1950 and up through the present.
Several of the teleconnection patterns impact temperatures in the vicinity of western Russia, these include teleconnections named “West Pacific Pattern” (WP), “Polar/Eurasia Pattern” (POL), and the “East Atlantic/Western Russia Pattern” (EA/WR).
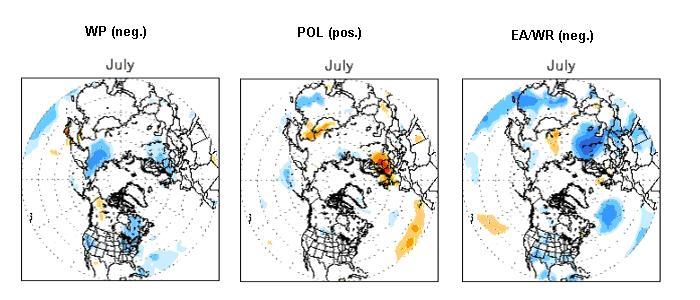
Figure 1 shows the July pattern of surface temperature anomalies when each of these three teleconnections is in their positive mode. When the teleconnections are in their negative mode, the temperature anomaly patterns are reversed. Notice that all three have “hot spots” in an around western Russia. The value of the WP, POL, and EA/WR indices for July, respectively were -2.93, 1.7, and -1.55. This means that each of these teleconnections was in a configuration that leads to higher than normal temperatures in western Russia.
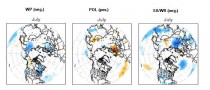
Figure 1. Pattern of temperature anomalies that is associated with the positive mode of three teleconnections influencing western Russia (figures from the Climate Prediction Center). Enlarged here.
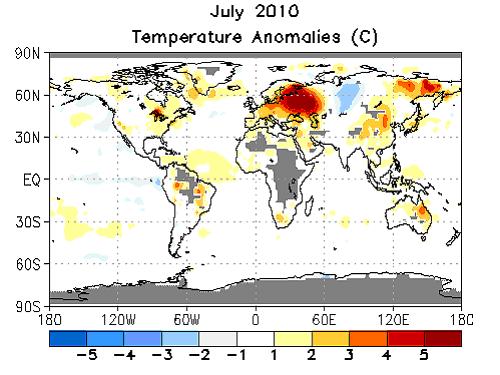
Figure 2 shows the observed surface temperature anomalies for July, which include the big bull’s eye of high temperatures over western Russia - an expected result of the chance combination of the three teleconnection patterns.

Figure 2. Surface temperature anomalies (C) for July, 2010 (figure from the Climate Prediction Center). Enlarged here.
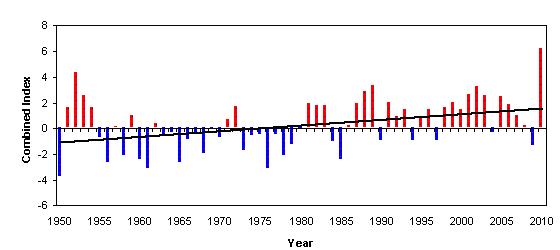
Figure 3 shows the timeseries of the combination (sum) of the July values for the WP, POL, and EA/WR teleconnection indices (we first flipped the sign of the WP and EA/WR indices so that the combined index reflects the same sign of the temperature anomalies over western Russia).
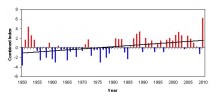
Figure 3. Combined index of the WP, POL, and EA/WR telectonnection values for the month of July, 1950-2010 (data from the CDC). Enlarged here.
There are several things of note:
1) The July 2010 combined value is the highest since 1950 - nearly 50% greater than the second highest value which occurred in 1952.
2) The combined index has been mostly positive since 1981, and mostly negative from 1955 through 1980. This behavior imparts an overall positive trend since 1950.
3) The 2010 value is about 3 times greater than the value expected based on the trend alone.
Is anthropogenic global warming behind any of this behavior?
It is hard to know for sure, but one thing that is certain is that if global warming does have a hand in the game (perhaps through the trend term), what it’s holding is pretty weak.
Figure 4 is a map of temperature anomalies for July 1936 - another very hot month in western Russia. Notice how the general pattern of temperature anomalies looks a lot like those from July 2010 (in Figure 2). This would suggest that the combined teleconnection index for July 1936 was also quite high - we don’t know how high, because the compiled data from the CPC only goes back to 1950. But clearly, it can get hot in Moscow and western Russia without our help.
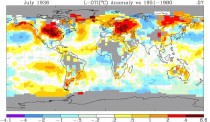
Figure 4. Surface temperature anomalies (C) for July, 1936 (figure from the Goddard Institute for Space Studies).
The lack of data on teleconnections prior to 1950 limits the historical setting within which we can place the 2010 event. Would the increasing trend exhibited in Figure 3 look the same if we had that included the known warm period of the 1930s? Just how high was the combined teleconnection index in July of 1936?
We don’t know. And lacking that knowledge, it is hard to ascertain what role other factors such as urbanization, smoke, or global warming may have had in making this summer a record summer in western Russia.
On its own, the summer of 2010 would have gone down in history as an extremely hot one in Moscow, with or without any influence from enhanced greenhouse gas concentrations.
Did our changes to the environment, locally, regionally, or globally add even a bit more to what nature had in store already?
Possibly? Probably?
The jury is still way out on this one.
See post on this one.
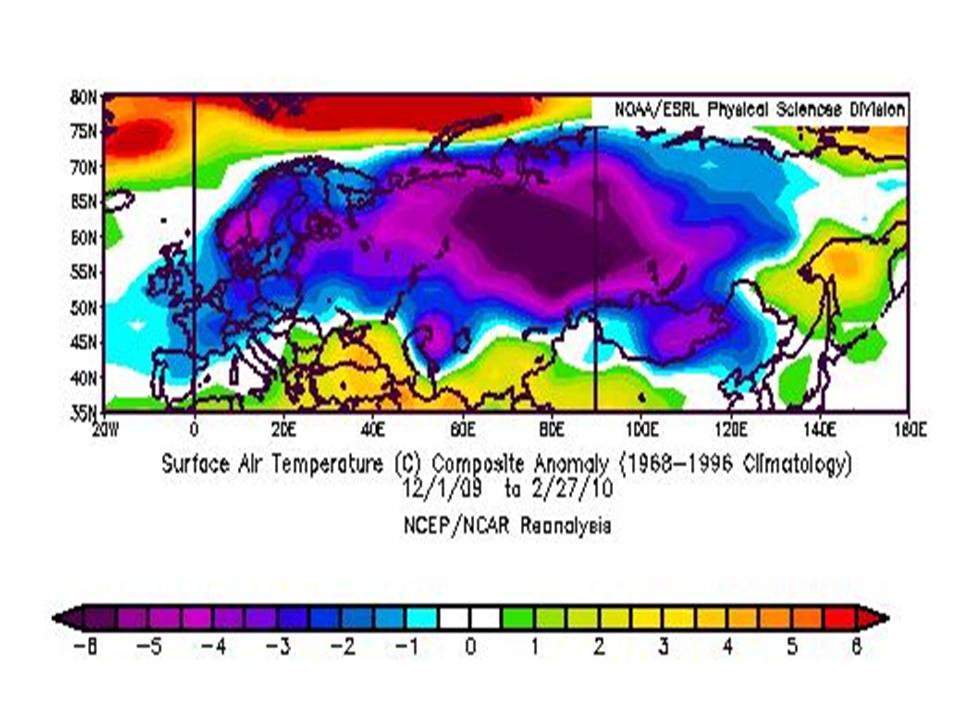
ICECAP NOTE: Recall this same area had one of the coldest (in places said to be the coldest) winter on record this past winter, again as the blocking pattern locked in, then with the ridge in the North Atlantic. Enlarged here.

But then we were told that was weather and the extremes were consistent with AGW.