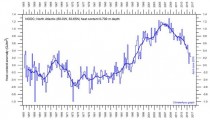
The warning signs have been there for some time now - persistent failures of the wheat crop in Norway for example. The North Atlantic is cooling. The cooling trend was evident at the time of an expedition to investigate this phenonemon three years ago. The rate of cooling has now steepened up since then based on the latest data collated by Professor Humlum of the University of Oslo. From that data set, this graph shows the heat loss since 2004 for the top 700 metres of the water column:
Enlarged
Figure 1: Monthly heat content anomaly in the uppermost 700 metres of the North Atlantic
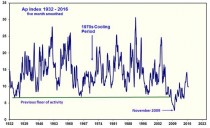
As Figure 1 show, North Atlantic heat content peaked in 2004. The decline since the peak has been steeper than the rise. What would be the reason for 2004 being the peak year? Part of the answer may be that 2004 was the second peak of Solar Cycle 23 with a big increase in the proton flux. Another part of the answer may be that there was a big fall in the Ap Index in 2005 down to solar minimum-like levels followed, a couple of years later, by a discontinuity as the level fell through the floor of the established minimum level of activity. That is shown in this graph:
Enlarged
Figure 2: Ap Index 1932 - 2016
We might not care too much about the animals that live in the North Atlantic water column but the temperature of the surface is the main control on the climate of Europe. So what has that been doing?
Enlarged
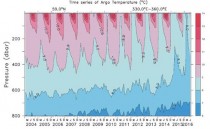
Figure 3: Time series depth-temperature diagram along 59 N across the North Atlantic Current from 30W to 0W.
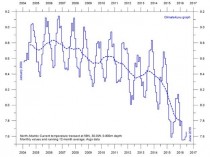
As Figure 3 from Professor Humlum’s work shows, summer heating is penetrating to half the depth it used to 10 years ago and in winter earlier this year sub 8C water was at the surface for the first time in more than ten years. That cooling trend is quantified in the following graph:
Enlarged
Figure 4: Average temperature along 59N, 30 to 0W, 0 to 800m depth
This is data from the main part of the North Atlantic Current. The average temperature has fallen 1.0C from 2006 to 2016. That is a trend of 1.0C per decade but with 60% of the cooling in the last two years. Europe’s climate has responded with snow down to 2,000 metres in August in Germany this year. And how much lower can the North Atlantic temperature go? The lowest point on Figure 1 was in 1973 during the 1970s cooling period and corresponds to a fall of a further 1.5C. At the decadal trend since 2016, we would get there in 2031. At the trend of the last two years, we would get there in 2021.
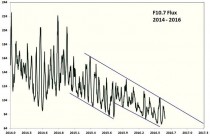
That is supported by what is happening to solar activity. Over those last two years the F10.7 flux has been in a steep downtrend:
Enlarged
Figure 5: F10.7 Flux 2014 - 2016
Figure 5 shows that the F10.7 flux is in a steep, orderly downtrend that will take it to the immutable floor of 64 about three years before solar minimum is due. After that comes Solar Cycle 25. Back in 2003, esteemed solar physicists Ken Schatten and Kent Tobiska warned that:
“The surprising result of these long-range predictions is a rapid decline in solar activity, starting with cycle #24. If this trend continues, we may see the Sun heading towards a “Maunder” type of solar activity minimum - an extensive period of reduced levels of solar activity.”
They got the decline of Solar Cycle 24 right and the North Atlantic cooled in response. If they get the “Maunder’ part of their prediction correct too, then it will be some years before North Atlantic cooling bottoms out.


