


By William M. Briggs, Statistician to the Stars

“J’accuse! A statistician may prove anything with his nefarious methods. He may even say a negative number is positive! You cannot trust anything he says.”
Sigh. Unfortunately, this oft-hurled charge is all too true. I and my fellow statisticians must bear its sad burden, knowing it is caused by our more zealous brethren (and sisthren). But, you know, it really isn’t their fault, for they are victims of loving not wisely but too well their own creations.
First, a fact. It is true that, based on the observed satellite data, average global temperatures since about 1998 have not continued the rough year-by-year increase that had been noticed in the decade or so before that date. The temperatures since about 1998 have increased in some years, but more often have they decreased. For example, last year was cooler than the year before last. These statements, barring unknown errors in the measurement of that data, are taken as true by everybody, even statisticians.
The AP gave this data - concealing its source - to “several independent statisticians” who said they “found no true temperature declines over time” (link)
How can this be? Why would a statistician say that the observed cooling is not “scientifically legitimate”; and why would another state that noticing the cooling “is a case of ‘people coming at the data with preconceived notions’”?
Are these statisticians, since they are concluding the opposite of what has been observed, insane? This is impossible: statisticians are highly lucid individuals, its male members exceedingly handsome and charming. Perhaps they are rabid environmentalists who care nothing for truth? No, because none of them knew the source of the data they were analyzing. What can account for this preposterous situation!
Love. The keen pleasures of their own handiwork. That is, the adoration of lovingly crafted models.
Let me teach you to be a classical statistician. Go to your favorite climate site and download a time series picture of the satellite-derived temperature (so that we have no complications from mixing of different data sources); any will do. Here’s one from our pal Anthony Watts.
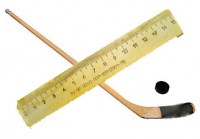
Now fetch a ruler - a straight edge - preferably one with which you have an emotional attachment. Perhaps the one your daughter used in kindergarten. The only proviso is that you must love the ruler.
Place the ruler on the temperature plot and orient it along the data so that it most pleases your eye. Grab a pencil and draw a line along its edge. Then, if you can, erase all the original temperature points so that all you are left with is the line you drew.
If a reporter calls and asks if the temperature was warmer or colder last year, do not use the original data, which of course you cannot since you erased it, but use instead your line. According to that very objective line the temperature has obviously increased. Insist on the scientificity of that line - say that according to its sophisticated inner-methodology, the pronouncement must be that the temperature has gone up! Even though, in fact, it has gone down.
Don’t laugh yet, dear ones. That analogy is too close to the truth. The only twist is that statisticians don’t use a ruler to draw their lines - some use a hockey stick. Just kidding! (Now you can laugh.) Instead, they use the mathematical equivalent of rulers and other flexible lines.
Your ruler is a model Statisticians are taught - their entire training stresses - that data isn’t data until it is modeled. Those temperatures don’t attain significance until a model can be laid over the top of them. Further, it is our credo to, in the end, ignore the data and talk solely of the model and its properties. We love models!
All this would be OK, except for one fact that is always forgotten. For any set of data, there are always an infinite number of possible models. Which is the correct one? Which indeed!
Many of these models will say the temperature has gone down, just as others will say that it has gone up. The AP statisticians used models most familiar to them; like “moving averages of about 10 years” (moving average is the most used method of replacing actual data with a model in time series); or “trend” models, which are distinct cousins to rulers.
Since we are free to choose from an infinite bag, all of our models are suspect and should not be trusted until they have proven their worth by skillfully predicting data that has not yet been seen. None of the models in the AP study have done so. Even stronger, since they said temperatures were higher when they were in fact lower, they must predict higher temperatures in the coming years, a forecast which few are making.
We are too comfortable with this old way of doing things. We really can prove anything we want with careful choice of models.
Read more here.