


Met Office Computer Models Are Complete Rubbish
Met Office 3-month Outlook, 23 March 2012: “The forecast for average UK rainfall slightly favours drier-than-average conditions for April-May-June as a whole, and also slightly favours April being the driest of the 3 months. With this forecast, the water resources situation in southern, eastern and central England is likely to deteriorate further during the April-May-June period… This forecast is based on information from observations, several numerical models and expert judgement.”
Reality
April: 2012 had wettest April for 100 years, Met Office says “It has been the wettest April in the UK for over 100 years, with some areas seeing three times their usual average, figures from the Met Office show. Some 121.8mm of rain has fallen, beating the previous record of 120.3mm which was set in 2000.”
June: June on course to be wettest in a century: Flooding, storms and persistent showers have blighted the country in recent weeks putting this June in line to become one of the soggiest in 100 years.
25 June: Spring is wettest in Britain for 250 years - England and Wales are on course for the wettest late spring and early summer for 250 years, experts said yesterday. June has just seen its fourth washout weekend and yet more downpours are forecast. Now it is feared combined rainfall for April, May and June will break the record of 13.2in (336mm) set in 1782 and be the highest since records began in 1766.
------------------
Unscientific American on line chat on heat wave to cultists - blames 90s this week on AGW
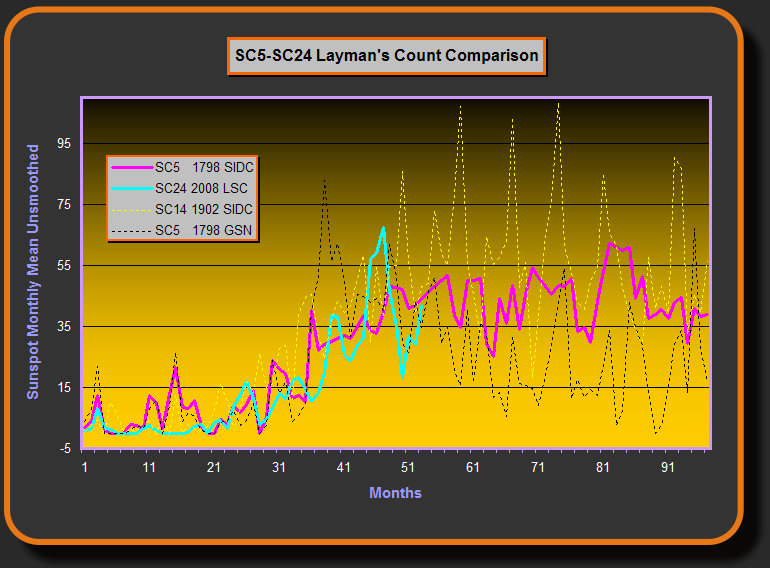
Note: the sun 3 years and 7 months after the solar minimum.
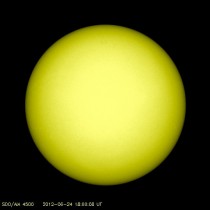
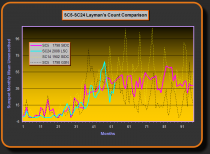
By using other spectral bands and zooming in very close, the observatories are able to see a few pores or specks that never would have been seen with old technology. Sunspot number yesterday was between 10 and 13 unadjusted. Three days without a sunspot on Layman’s Sunspot site which tracks only spots large enough to have been seen before. We are tracking very close to cycle 5 in the Dalton Minimum.
There is a lag of maybe 8 years between solar activity levels and global temperature affects. The sun went very quiet after 2006, which would suggest temperatures will dive in a year or two. The leveling off since 1997 has been due to the change in the PDO to cool. When the sun cooling sets in and the Atlantic cooling begins (5-10 years), the world will be focused on cold and how we can get more fossil fuels to provide heat because the wind farms and solar farms are not meeting the needs. Recall that despite a huge investment in wind in the UK, in the frigid weather of December 2010, the wind provided just 0.6% of the electricity need for the UK and millions were placed needlessly in energy poverty, having to make a decision whether to heat or eat. That is our future if Obama and his green pals continue their rule and the EPA is not controlled.
See Joe Bastardi challenge Jeff Masters of Weather Underground (name says it all) on the role of the sun and oceans on Real Science.
-------------------
By Joseph D’Aleo
Today the once great magazine Scientific American continued to propagate the hoax of global warming by blaming the two day heat wave in the east on greenhouse gases. They held an on line briefing by David Biello, chief propagandist today.
Overview Extreme Weather and Climate Change
Several temperature records were broken along the East Coast on Tuesday, with the mercury reaching into the high 90s at all three New York City airports and parts further north, such as Burlington, Vt., where residents and businesses are ill-prepared for such heat. The heat wave is expected to continue through the end of the work week along the Eastern Seaboard, and severe storms are parked over the Midwest, causing floods in Duluth, Minn.
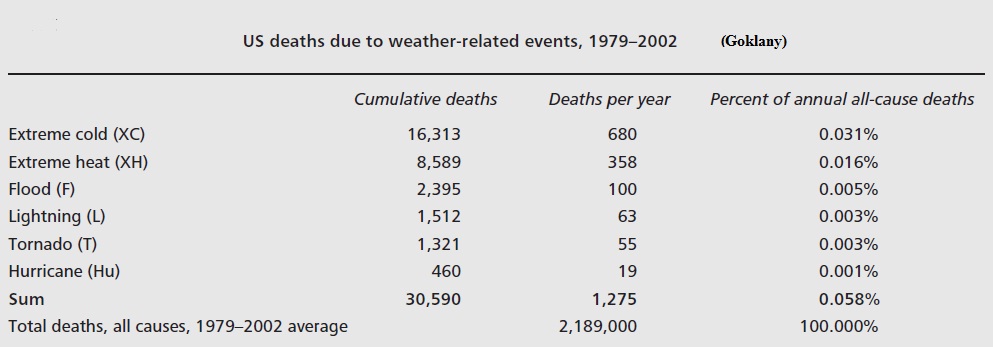
Hot weather is an often overlooked cause of death worldwide and in the U.S., especially in low-income urban areas where residents might lack air-conditioners. In fact, high heat is the number one weather-related cause of death in the U.S. In an average year, heat kills more people than floods, hurricanes, lightning and tornadoes combined, according to the National Weather Service.
--------------------------
Lets look at the facts.
First of all extreme cold kills twice as many as extreme heat. This will increase in the future if the greens have their way as power brownouts and blackouts and soaring heating oil prices and electricity rates put more and more people into fuel poverty. This will also cause more deaths from the heat waves that are an inevitable part of summer.
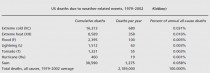
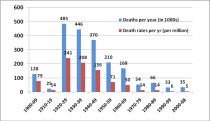
Here is a look at Global Death and Death Rates Due to Extreme Weather Events, 1900-2008. Source: Goklany (2009), based on EM-DAT (2009), McEvedy and Jones (1978), and WRI (2009). Global rates have declined, which is disappointing to the radical population control freaks among the greens.
Enlarged
This month in the northeast had been cool without 90 degree days the first 19 days. Boston was averaging 4.7F below normal and Central Park 2.5F below. Cooler than normal weather followed the three day summer heat.
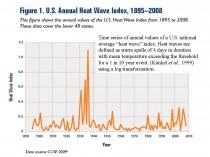
Here is the EPA’s own heat wave Index.
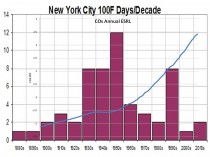
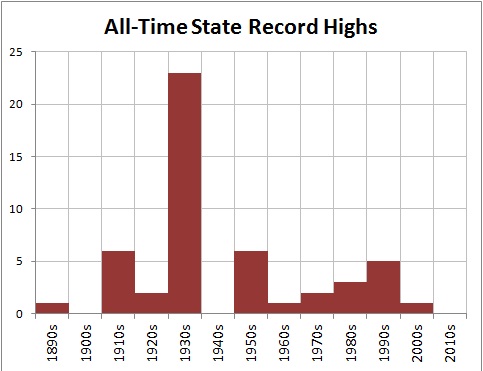
Here is a plot of state all-time record highs by decade.

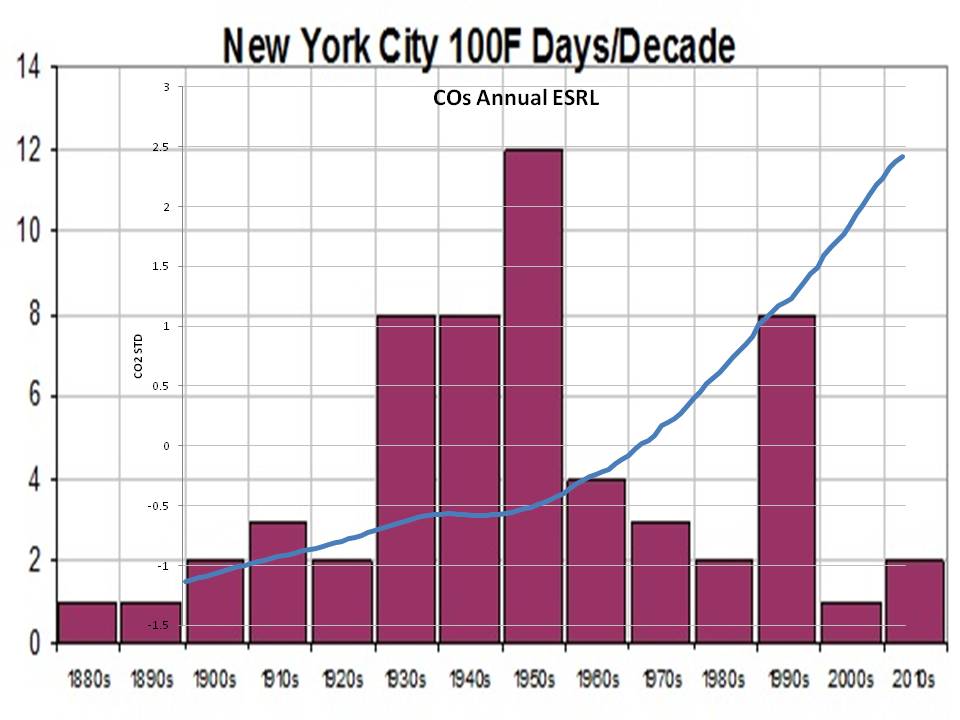
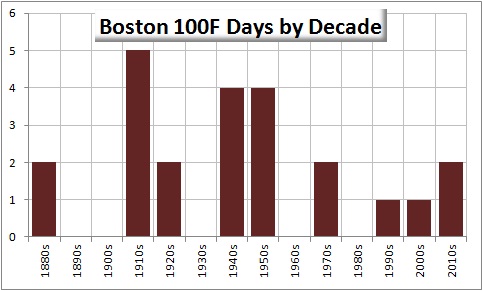
Temperatures did not reach 100F in NYC or BOS. 100F are not new phenomena. Also there is NO correlation with CO2.
Boston also shows no upward trend.

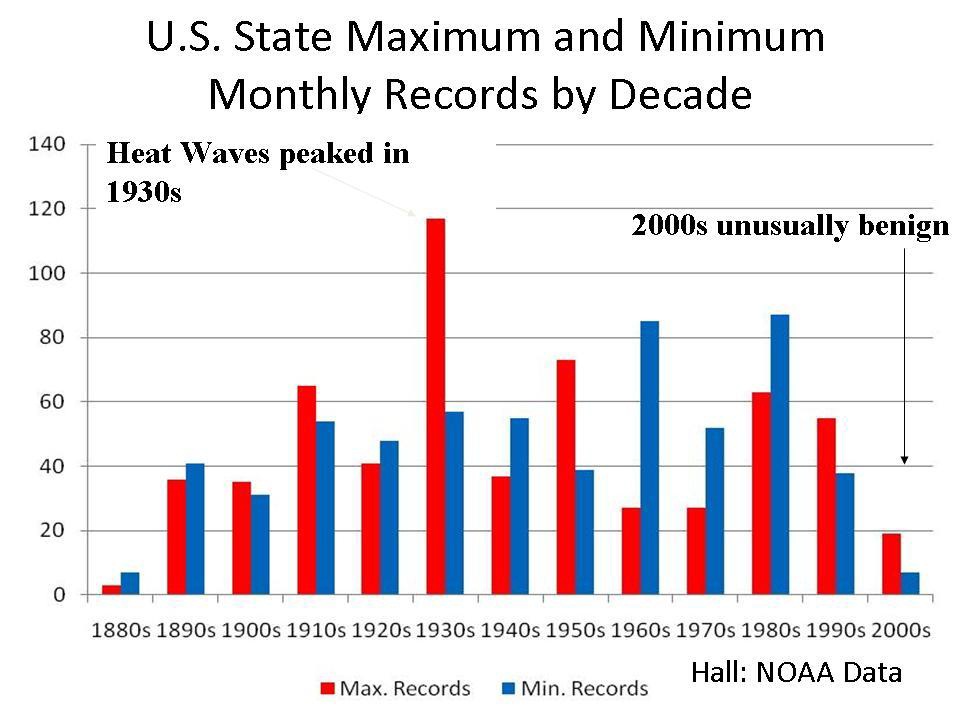
Here is all 50 states all 12 months the records by decade through the 2000s. Latest occuring record year used.

The 2000s was an unusually benign decade. Last year had some brutal heat in Texas and Oklahoma and yes, this past winter and spring on the rebound from the second strongest La Nina in history and two of the coldest winters it was warm in the lower 48 states (though brutally cold in Eurasia and Alaska.
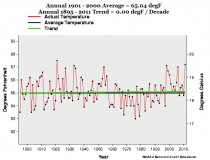
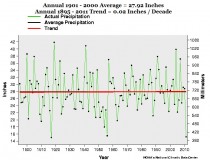
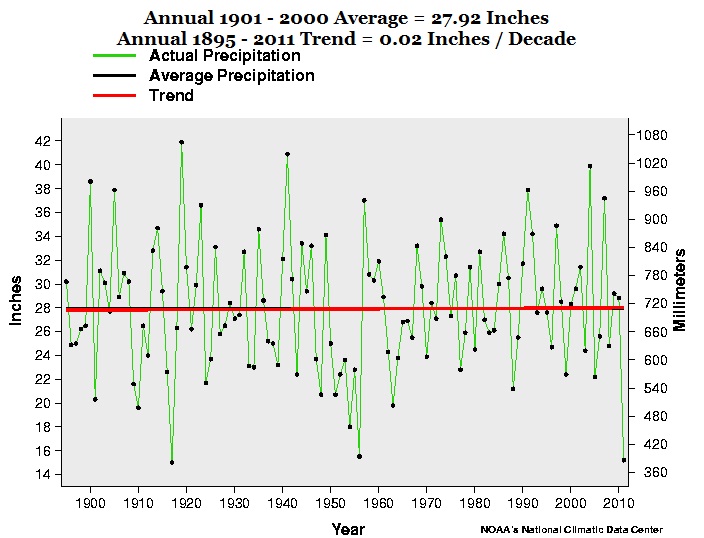
Even with the heat and drought, the last 117 years shows no trend for Texas in Temperatures and a very slight upward trend for precipitation.
Let’s see the tune Biello plays in winter when the snow and cold invade North America and the lower 48 states as a weak El Nino comes on. I am glad I cancelled my subscription to Scientific American and Science and Nature. You may wish to consider the same.