


In the very first US operational data set in the late 1980s, adjustments were built in to correct for urbanization in the national network in growing cities and 70% of the network stations that were airport. In the following versions the original adjustment algorithms were removed and a data trace that better mapped the AGW claims of man made CO2 warming. Fortunately NOAA with a push from Dr. John Christy, set up a network of carefully sited stations as he used in Alabama where he was the state climatologist. NOAA never discusses this data gem but makes the data available monthly if you can find it on their site. See even with the warming globally that may be driven in part the last few years by TONGA (see) and also on WUWT, the warming trend is minimal.
May 2024 | 1.21F (0.67C)
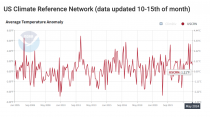
US Climate Reference Network (data updated 10-15th of month)
Click for description of the data/larger graph
The US Climate Reference Network record from 2005 shows no obvious warming during this period. The graph above is created monthly by NOAA.
The graph shows the Average Surface Temperature Anomaly for the contiguous United States since 2005. The data comes from the U.S. Climate Reference Network (USCRN) which is a properly sited (away from human influences and infrastructure) and state-of-the-art weather network consisting of 114 stations in the USA.
These station locations were chosen to avoid warm biases from Urban Heat Islands (UHI) effects as well as microsite effects as documented in the 2022 report Corrupted Climate Stations: The Official U.S. Surface Temperature Record Remains Fatally Flawed. Unfortunately, NOAA never reports this data in their monthly or yearly “state of the climate report.” And, mainstream media either is entirely unaware of the existence of this data set or has chosen not to report on this U.S. temperature record.
The national USCRN data, updated monthly as shown in the above graph can be viewed here and clicking on ClimDiv to remove that data display in the graph here.
---------
See a history of weather data changes and manipulations over time here.
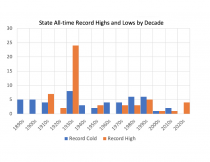
They ignore the actual heat records. The 1930s were clearly the hottest years for all-time state record highs. There have been more record lows than all time highs since then.