


Confirmation of the Dependence of the ERA-40 Reanalysis Data on the Warm Bias in the CRU Data
By Roger Pielke Sr, Climate Science Blog
There is a remarkable admission in the leaked e-mails from Phil Jones of the dependence of the long term surface temperatures trends in the ERA-40 reanalysis on the surface temperature data from CRU. This is a very important issue as ERA-40 is used as one metric to assess multi-decadal global surface temperature trends, and has been claimed as an independent assessment tool from the surface temperature data. The report ECMWF Newsletter No. 115 - Spring 2008 overviews the role of ERA-40 in climate change studies.
The paper by Eugenia (Kalnay) that is presumably being referred to in the Phil Jones e-mails, which I have presented later in this post, is There is a remarkable admission in the leaked e-mails from Phil Jones of the dependence of the long term surface temperatures trends in the ERA-40 reanalysis on the surface temperature data from CRU.
This is a very important issue as ERA-40 is used as one metric to assess multi-decadal global surface temperature trends, and has been claimed as an independent assessment tool from the surface temperature data. The report ECMWF Newsletter No. 115 - Spring 2008 overviews the role of ERA-40 in climate change studies.
The paper by Eugenia (Kalnay) that is presumably being referred to in the Phil Jones e-mails, which I have presented later in this post, is Kalnay, E., and M. Cai, 2003: Impact of urbanization and land-use on climate change. Nature, 423, 528-531.
There are a number of subsequent papers that have built on the ‘observation minus reanalysis’ (OMR) method analysis methodology introduced by Eugenia including
Kalnay, E., M. Cai, H. Li, and J. Tobin, 2006: Estimation of the impact of land-surface forcings on temperature trends in eastern Unites States. J. Geophys. Res., 111, D06106,doi:10.1029/2005JD006555.
Lim, Y.-K., M. Cai, E. Kalnay, and L. Zhou, 2005: Observational evidence of sensitivity of surface climate changes to land types and urbanization. Geophys. Res. Lett., 32, L22712, doi:10.1029/2005GL024267.
Nunez, Mario N., H. H. Ciapessoni, A. Rolla, E. Kalnay, and M. Cai, 2008: Impact of land use and precipitation changes on surface temperature trends in Argentina. J. Geophys. Res. - Atmos., 113, D06111, doi:10.1029/2007JD008638, March 29, 2008
Fall, S., D. Niyogi, A. Gluhovsky, R. A. Pielke Sr., E. Kalnay, and G. Rochon, 2009: Impacts of land use land cover on temperature trends over the continental United States: Assessment using the North American Regional Reanalysis. Int. J. Climatol., DOI: 10.1002/joc.1996.
Following is the July 8 2004 e-mail from Phil Jones. I have made bold font the text that specifically refers to the conenction between the ERA-40 reanalysis and the CRU data.
From: Phil Jones
Subject: HIGHLY CONFIDENTIAL
Date: Thu Jul 8 16:30:16 2004
Mike,
Only have it in the pdf form. FYI ONLY - don’t pass on. Relevant paras are the last 2 in section 4 on p13. As I said it is worded carefully due to Adrian knowing Eugenia for years. He knows the’re wrong, but he succumbed to her almost pleading with him to tone it down as it might affect her proposals in the future ! I didn’t say any of this, so be careful how you use it - if at all. Keep quiet also that you have the pdf. The attachment is a very good paper - I’ve been pushing Adrian over the last weeks to get it submitted to JGR or J. Climate. The main results are great for CRU and also for ERA-40. The basic message is clear - you have to put enough surface and sonde obs into a model to produce Reanalyses. The jumps when the data input change stand out so clearly. NCEP does many odd things also around sea ice and over snow and ice.
The other paper by MM is just garbage - as you knew. De Freitas again. Pielke is also losing all credibility as well by replying to the mad Finn as well - frequently as I see it. I can’t see either of these papers being in the next IPCC report. Kevin and I will keep them out somehow - even if we have to redefine what the peer-review literature is !
Cheers
Phil
Mike,
For your interest, there is an ECMWF ERA-40 Report coming out soon, which shows that Kalnay and Cai are wrong. It isn’t that strongly worded as the first author is a personal friend of Eugenia. The result is rather hidden in the middle of the report. It isn’t peer review, but a slimmed down version will go to a journal. KC are wrong because the difference between NCEP and real surface temps (CRU) over eastern N. America doesn’t happen with ERA-40. ERA-40 assimilates surface temps (which NCEP didn’t) and doing this makes the agreement with CRU better. Also ERA-40’s trends in the lower atmosphere are all physically consistent where NCEP’s are not - over eastern US.
I can send if you want, but it won’t be out as a report for a couple of months.
Cheers
Phil
The claim that “ERA-40 assimilates surface temps (which NCEP didn’t) and doing this makes the agreement with CRU better” is a circular argument as the CRU data (or its close proxy) is what ERA-40 assimilates, so of course it is better!
The claim that “[a]lso ERA-40’s trends in the lower atmosphere are all physically consistent where NCEP’s are not - over eastern Us” must just mean that the ERA-40 agrees better with the IPCC model predictions. To use a model prediction to test a reanalysis trend product is, of course, a violation of the scientific process.
The e-mails from CRU documents sloppy science.
Since the ERA-4o data is a major climate assessment tool, the introduction of surface temperature data with a warm bias (e.g. see, see and see) means that ERA-40 necessarily also has a warm bias in the diagnosis of the magnitude of global warming. See post here.
Would You Like Your Temperature Data Homogenized, or Pasteurized?
By Basil Copeland on Watts Up With That
A Smoldering Gun From Nashville, TN
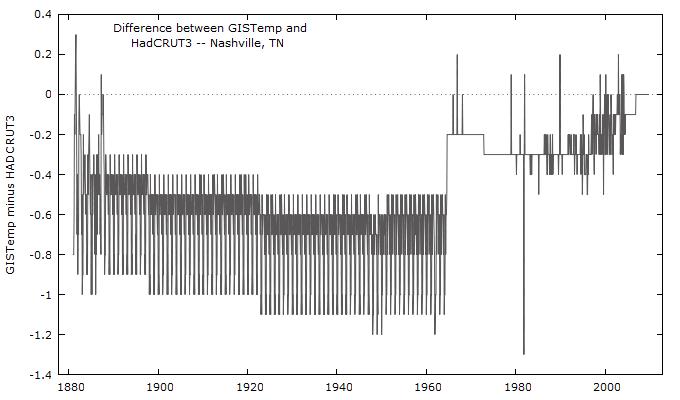
The hits just keep on coming. About the same time that Willis Eschenbach revealed “The Smoking Gun at Darwin Zero,” The UK’s Met Office released a “subset” of the HadCRUT3 data set used to monitor global temperatures. I grabbed a copy of “the subset” and then began looking for a location near me (I live in central Arkansas) that had a long and generally complete station record that I could compare to a “homogenized” set of data for the same station from the GISTemp data set. I quickly, and more or less randomly, decided to take a closer look at the data for Nashville, TN. In the HadCRUT3 subset, this is “72730” in the folder “72.” A direct link to the homogenized GISTemp data used is here. After transforming the row data to column data (see the end of the post for a “bleg” about this), the first thing I did was plot the differences between the two series (below, enlarged here):
The GISTemp homogeneity adjustment looks a little hockey-stickish, and induces an upward trend by reducing older historical temperatures more than recent historical temperatures. This has the effect of turning what is a negative trend in the HadCRUT3 data into a positive trend in the GISTemp version (below, enlarged here):
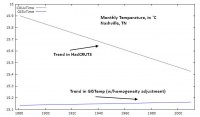
So what would appear to be a general cooling trend over the past ~130 years at this location when using the unadjusted HadCRUT3 data, becomes a warming trend when the homogeneity adjustment is supplied.
“There is nothing to see here, move along.” I do not buy that. Whether or not the homogeneity adjustment is warranted, it has an effect that calls into question just how much the earth has in fact warmed over the past 120-150 years (the period covered, roughly, by GISTemp and HadCRUT3). There has to be a better, more “robust” way of measuring temperature trends, that is not so sensitive that it turns negative trends into positive trends (which we’ve seen it do twice how, first with Darwin Zero, and now here with Nashville). I believe there is.
Temperature Data: Pasteurized versus Homogenized
In a recent series of posts, here, here, and with Anthony here, I’ve been promoting a method of analyzing temperature data that reveals the full range of natural climate variability. Metaphorically, this strikes me as trying to make a case for “pasteurizing” the data, rather than “homogenizing” it. In homogenization, the object is to “mix things up” so that it is “the same throughout.” When milk is homogenized, this prevents the cream from rising to the top, thus preventing us from seeing the “natural variability” that is in milk. But with temperature data, I want very much to see the natural variability in the data. And I cannot see that with linear trends fitted through homogenized data. It may be a hokey analogy, but I want my data pasteurized - as clean as it can be - but not homogenized so that I cannot see the true and full range of natural climate variability. See full post here.
See this post on GISS Raw Station Data Before and After Homogenization for an eye opening view into blatant data manipulation and truncation.