


By Joseph D’Aleo
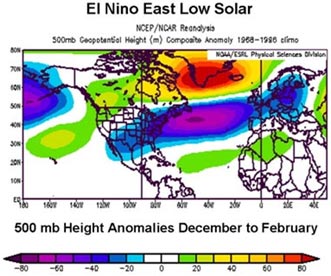
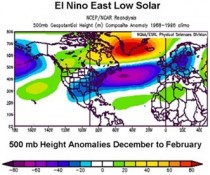
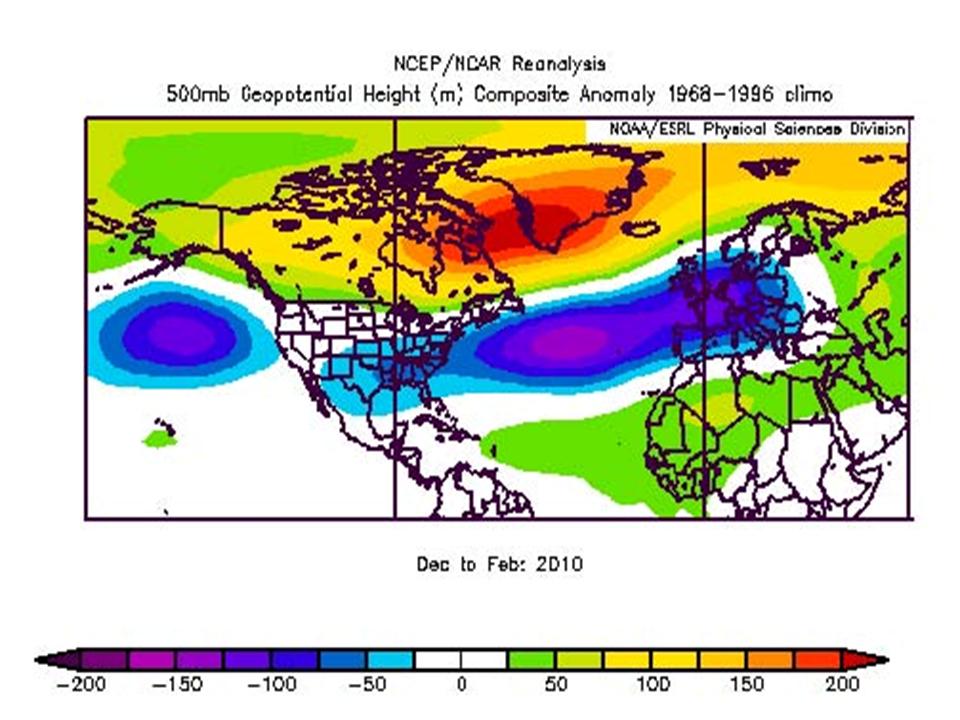
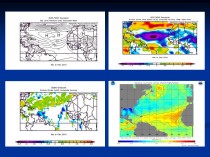
The pop in global temperatures, even the satellite lower troposphere, the last few months seems surprising to some in the Northern Hemisphere where the winter was hard. In Russia, it may have been the coldest on record, while across northern China, Europe and the southern and central United States, it was the coldest since the late 1970s or even the early 1960s. It was not unexpected. In the late fall, we showed the following upper level anomaly pattern was likely for the winter given the low solar, El Nino and developing east Quasi-Biennial Oscillation or QBO (shown in research by our own Climate Prediction Center to modulate solar and El Nino Southern Oscillation or ENSO) (enlarged here).
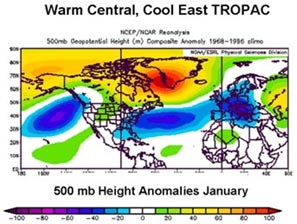
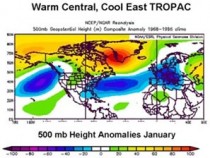
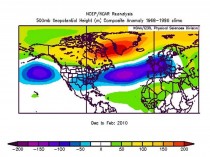
Also the warmest water in the Pacific was biased towards the central Pacific most of the winter. This pattern given the name Modoki, produces this very similar pattern in winter (enlarged here).
See how well the actual winter 500mb anomalies correlated to the two patterns (enlarged here).
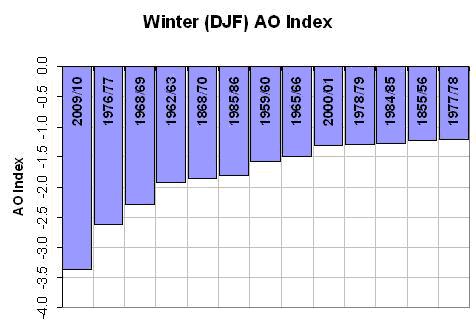
Both had a very strong high latitude blocking signal (above normal heights in polar regions). This high latitude blocking is reflected in the negative arctic oscillation state, a record since 1950 (enlarged here).

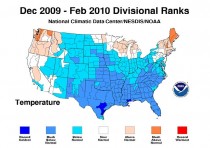
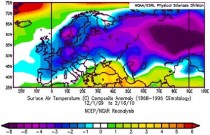
The effect on the surface has been a cold winter as discussed in the US and across Eurasia (enlarged here) and here .
So why the satellite temperature blip upwards? First of all the temperatures always spike up in El Ninos and down in La Ninas (enlarged here).
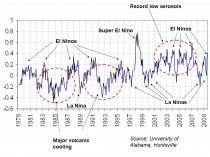
This is because El Ninos translate into warm tropics and subtropics. When the AO is strongly negative the subtropical jet stream is depressed south and the subtropical high pushed south and weakens. This results in weakened trade winds and easterlies. The high pressure causes increased subsidence which results in less cloudiness. Both of these factors lead to warmer water in both the tropics and subtropics. Since these latitude bands have the largest areas (the earth’s circumference is greatest at the equator), they contribute to the global blip. You can see the suppressed subtropical high, winds, cloudiness and elevated temperatures here (enlarged here).
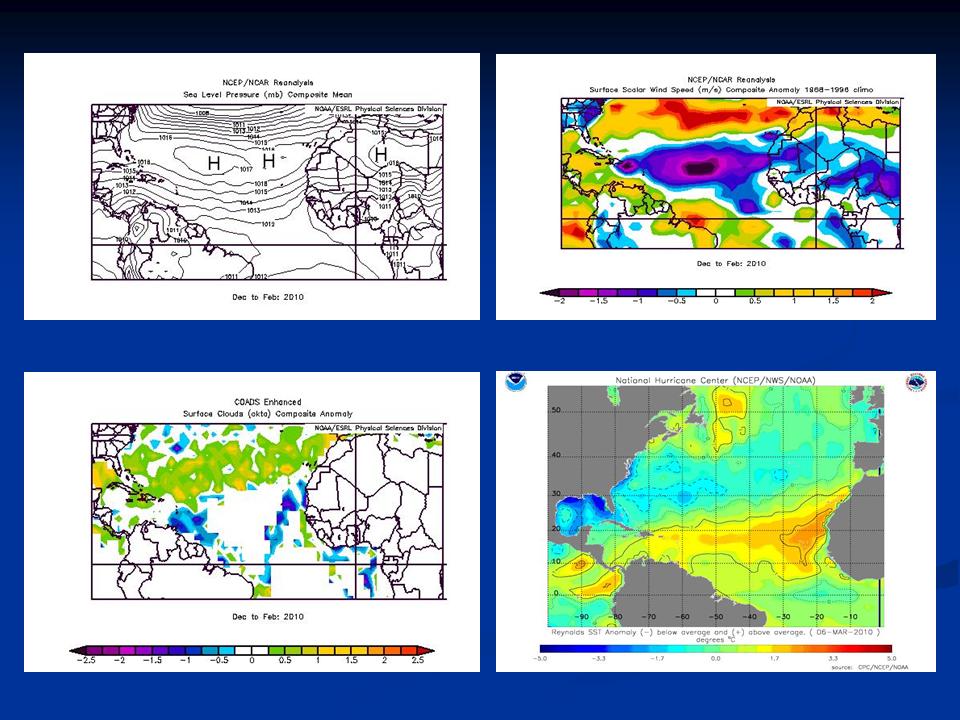
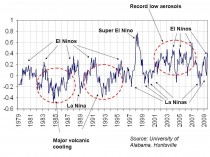
THE PDO POPS BUT WILL DECLINE
The PDO also popped slightly positive. It usually tracks with El Nino and La Nina. Here we see how it tracks with one El Nino measure, the Multivariate ENSO Index (MEI) of NOAA CDC’s Klaus Wolter (enlarged here).
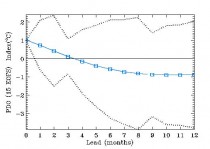
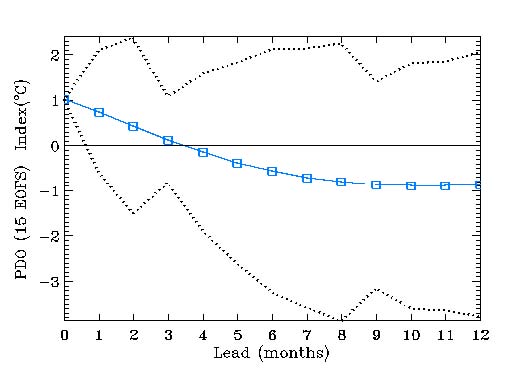
But if indeed we are in the cold PDO multidecadal mode, it should quickly decline as La Nina return quickly. NOAA’s Climate Diagnostic Center’s PDO forecast agrees (enlarged here).
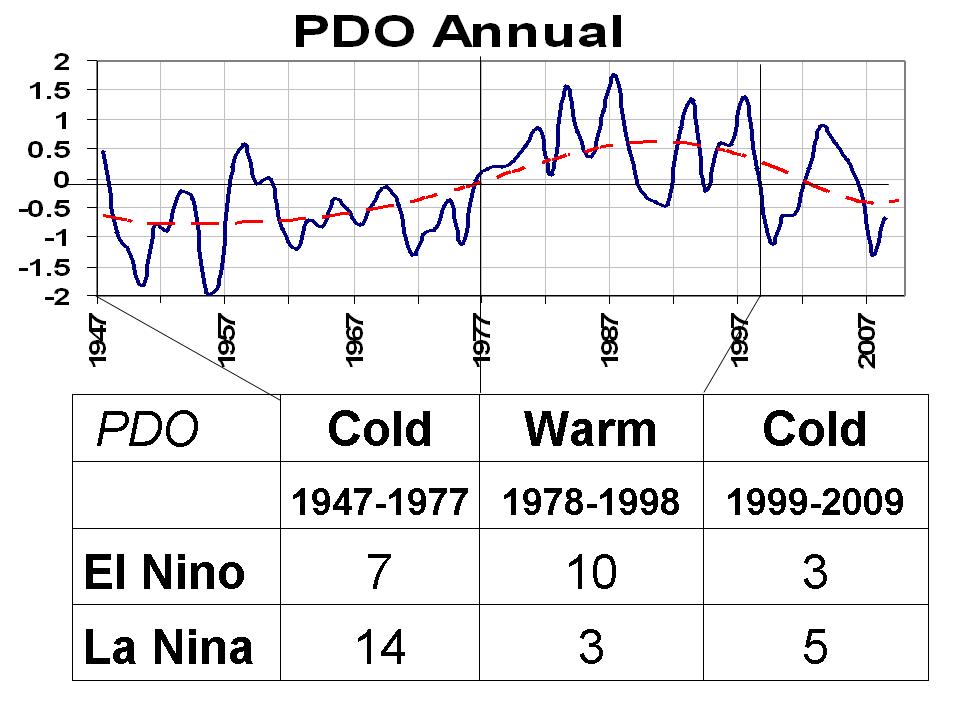
The PDO exhibits a 60 year multidecadal cycle. Notice La Ninas are more frequent, stronger and longer lasting in the cold modes and El Ninos briefer. The opposite is true for the warm mode. In both case, the ratio is 2 or 3 to 1 (enlarged here).
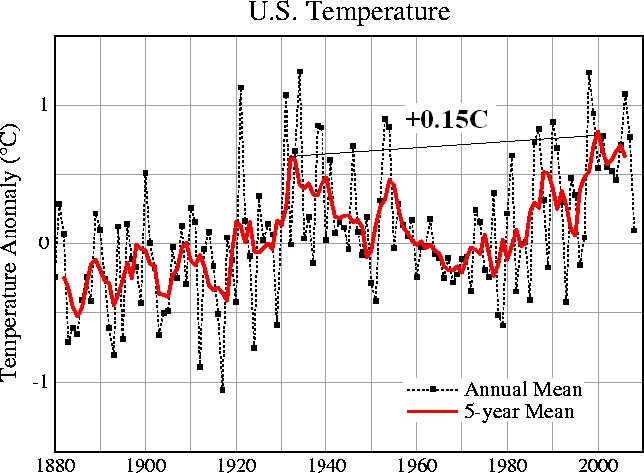
Since the El Ninos lead to warming and La Ninas cooling, this factor alone can explain the 60 year cycle in temperatures we have observed. The slight blip up reflects urbanization, land use changes / increasingly bad siting (enlarged here).
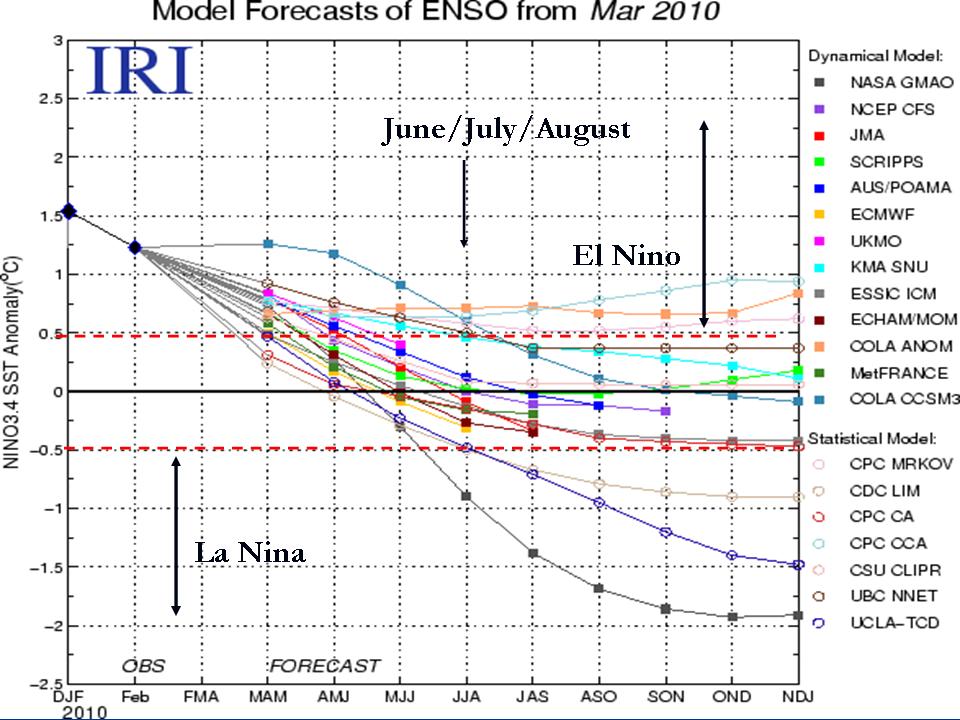
As discussed in a recent link, most ENSO models see a quick demise to this El Nino. Some have La Nina returning as early as this summer. This may mean a hot late summer for the central US but a return to cold across Alaska, Canada and the northern US this next winter (enlarged here).
So with a cooler La Nina and return to the negative PDO, temperatures should dip again much as they did in 2007 when we started the year with El Nino and ended with a strong La Nina. See much more here.