


By Joseph D’Aleo
We have noted in the last year that NOAA has often become the warmest of the 5 major data sets in their monthly globval anomalies. Thanks to Bob Tisdale, we have a better idea why that is the case. Bob occasionally cross posts on Watts Up With That and gets a mention on Climate Audit, for newbies, these three sites should be among your favorite bookmarks.
Recent Differences Between GISS and NCDC SST Anomaly Data And A Look At The Multiple NCDC SST Datasets
By Bob Tisdale
In the recent WUWT post Something hinky this way comes: NCDC data starts diverging from GISS, the differences between GISS and NCDC global temperature anomaly data was discussed. I commented that the GISS and NCDC global surface temperature anomaly data relied on two different SST datasets.
NCDC has their own SST anomaly dataset for their global surface temperature product, and they calculate anomalies against the base years of 1901 to 2000. GISS has used the NCDC OI.v2 SST anomaly data since December 1981, and before that they had used the Hadley Centre’s HADSST data. GISS then splices the two datasets together. This post does not discuss the HADSST data, but delves into the differences between the multiple NCDC SST anomaly datasets, one of which is used by GISS.
GRAPHS OF GLOBAL OI.v2 (USED BY GISS) and “NCDC Ocean” SST ANOMALY DATA
I have not been able to find GISS SST anomaly data as a separate dataset, so for a short-term comparison, I’ll use their source, the OI.v2 SST anomaly data available through the NOAA NOMADS system. Unfortunately, the OI.v2 SST data uses a third climatology for their anomalies (with base years of 1971-2000), but don’t let that concern you. It just makes for an unusual comparative graph.
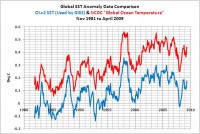
Figure 1 is a short-term comparison (November 1981 to April 2009) of the OI.v2 Global SST anomaly data (used by GISS) and the NCDC’s “Global Ocean Temperature”.
See larger image here.
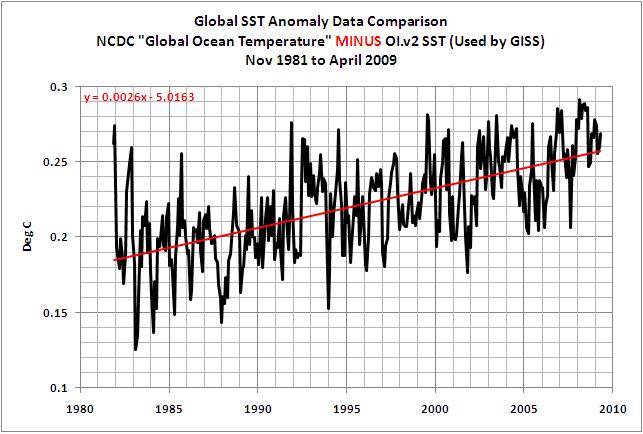
The two datasets appear to track one another, and the obvious difference, the shift in the data, is a result of the different base years. But if we subtract the OI.v2 SST data from the NCDC “Global Ocean” SST anomaly data, we can see that one dataset rose more than the other since November 1981. Refer to Figure 2. The NCDC “Global Ocean” SST anomaly dataset rose at a greater rate than the OI.v2 SST anomaly data that’s used by GISS. This would bias the NCDC global surface temperature upward over this time span, or bias the GISS data down, depending on your point of view.

See larger image here.
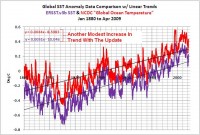
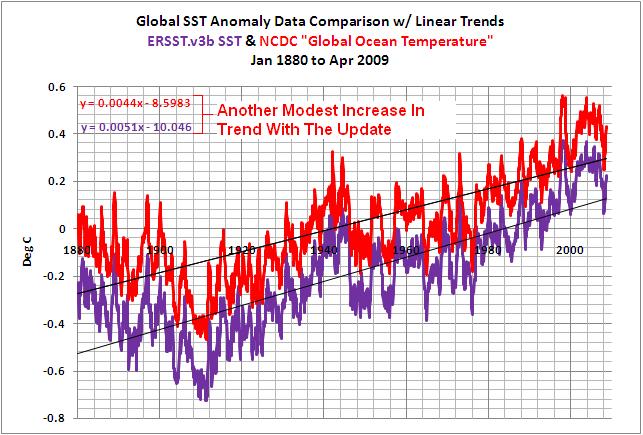
Reynolds, Smith, and Liu gave the reasons for removing the satellite data from ERSST.v3 data as, “In the ERSST version 3 on this web page WE HAVE REMOVED SATELLITE DATA from ERSST and the merged product. The addition of satellite data caused problems for many of our users. Although, the satellite data were corrected with respect to the in situ data as described in reprint, there was a residual cold bias that remained. The bias was strongest in the middle and high latitude Southern Hemisphere where in situ data are sparse. THE RESIDAL BIAS LED TO A MODEST DECREASE IN THE GLOBAL WARMING TREND AND MODIFIED GLOBAL ANNUAL TEMPERATURE RANKINGS.”
See larger image here.
Hmmm. It looks as though, if you’re a SST data producer, downward biases are bad, but increases in trend with each update are good. See much more
detail and get data links here.
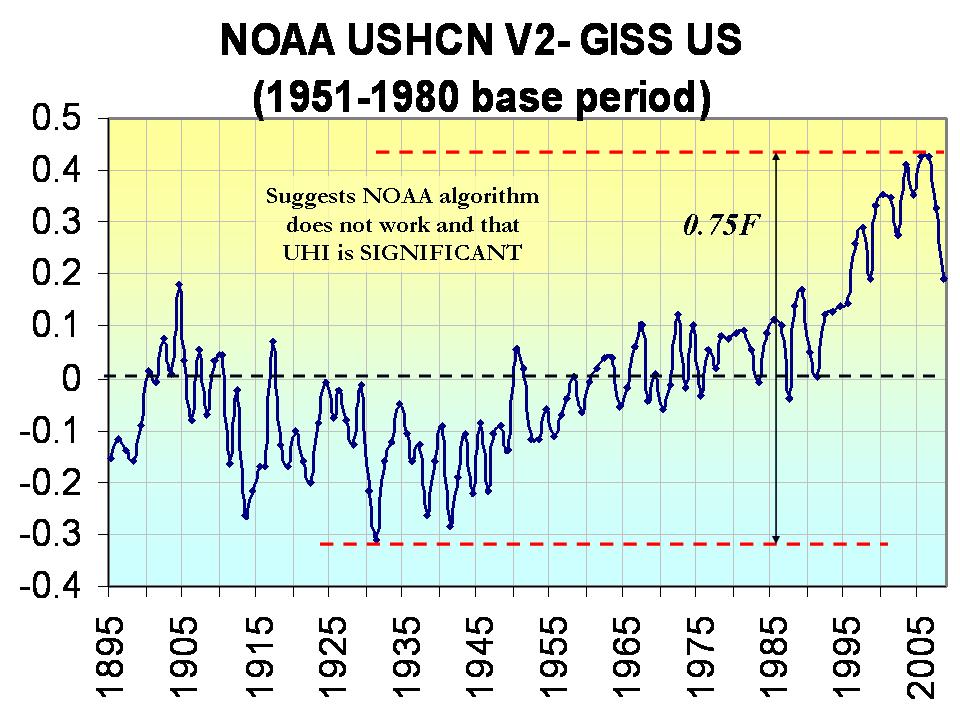
Icecap Note: NOAA and the other ground based data centers would have more credibility if one of the changes resulting in a reduction of the warming trend and not an exaggeration. Anthony Watts has clearly shown increasingly bad siting can lead to warm bias here. NOAA’s allowing 2/3rds of the world’s stations to dropout in 1990 led to more urban bias and thus warming, and NOAA has removed the US Urban Heat Island (UHI) adjustment and performs no UHI adjustment on global data. This is despite the facts that NCDC’s own Director Tom Karl in Kark et al (1988 J Climate) in Urbanization: its detection and effect in the United States climate record, showed the importance of urban adjustment and the Hadley Centre’s Phil Jones (2008) in Jones et al. ”Urbanization effects in large-scale temperature records, with an emphasis on China”, showed UHI’s contamination of data in China.
Removal of the UHI for the US resulted in a warming relative to GISS with UHI in the United States of 0.75F since 1940. Now having gotten all the warmth possible out of the land temperatures, they turn to the oceans, so promising as they cover 70% of the earth’s surface.

See larger image here.