By Joseph D’Aleo, CCM
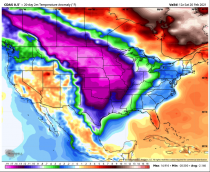
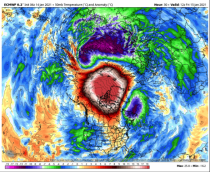
See the February temperature anomalies (as much as 36F below normal to 02/20). It reached down to Oklahoma and Texas with deadly results with ice and cold freeing wind turbines and snow covering solar panels.
We had our stratospheric warming in January after a lower level preview in mid-December. See the result is the arctic oscillation going negative.See the result is the arctic oscillation going negative (line graph beneath the maps).
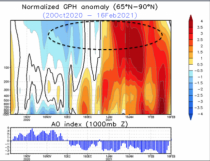
See the warming at 50mb.
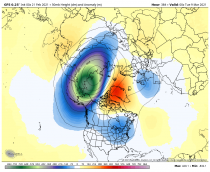
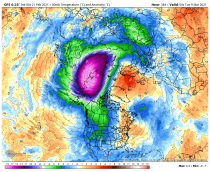
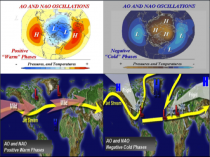
Warmings cause pressure to rise in the polar atmosphere that deliver cold air to mid latitudes (right) replacing the flat zonal flow with a cold arctic (left) which brings ocean modified air inland.
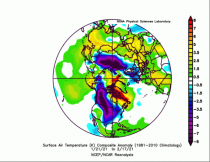
See the result the last month at the ground level.

See the cold plume into North America kept slightly west by the La Nina southeast ridge.
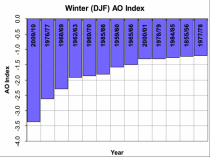
See how the AO was more negative that anytime since 2008-2010.
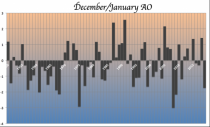
See the 2009/10 warming and persistent -AO.
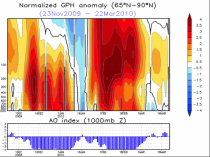
2009/10 was most negative since 1976/77.
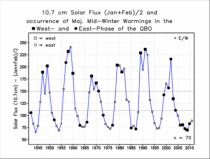
The warmings are more frequent near solar max and solar min.
The solar grand max was in the last century after a quiet start. See the deeper Dalton minimum in the early 1800s and the long Maunder in 1600s.

The cycles have been diminishing as it did early in the last two centuries.
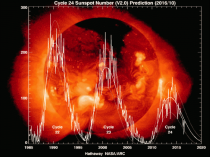
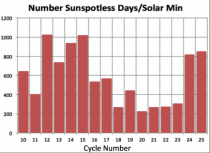
We have had longer minima with more sunspotless days.
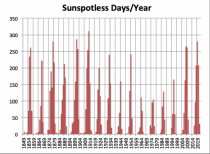
See how the min years the last two cycles have ranked among the highest. This min is not over yet and the number will climb more.
By the way the stratosphere has cooled but will warm again - another mid to late March flip? Happened in other years - late 1950s.
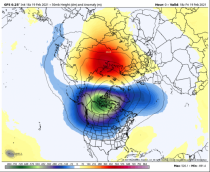
Warming in forecast high up in the Atlantic sector (affecting NAO?)
