


By Anthony Watts, Watts Up With That
UPDATE: The “ghost author” has been identified, see the end of the article. When I first saw it, I laughed. When I saw the internal memo circulated to top managers at NOAA, I laughed even more. Why? Because NOAA and NCDC are rebuking an analysis which I have not even written yet, using old data, and nobody at NOAA or NCDC had the professionalism to put their name to the document.
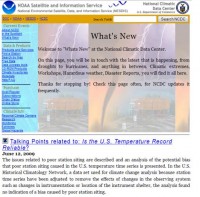
First let’s have a look at the National Climatic Data Center’s web page from a week ago:
I was quite surprised to find that my midterm census report on the surfacestations.org project evoked a response from NCDC. I suppose they are getting some heat from the citizenry and some congress critters over lack of quality control. I was even more surprised to see that they couldn’t even get the title right, particularly since the title of my report defines most of what NCDC is all about; Surface Temperature Measurement.
Here’s the title of my report released in March. “Is The U.S. Surface Temperature Record Reliable?”
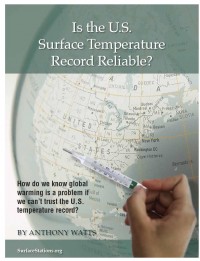
But NCDC calls it: “Is the U.S. Temperature Record Reliable?” True, a small omission, the word “surface”. But remember, this is a scientific organization that writes papers for peer reviewed journals, where accuracy in citation is a job requirement. Plus, the director of NCDC is Thomas Karl, who is now president of the American Meteorological Society. The Bulletin of the American Meteorological Society is considered a premiere peer reviewed journal, and Karl has written several articles. For him to allow a botched citation like this is pretty embarrassing. [NOTE: For those that just want to read my report, please feel free to download and read the free copy here PDF, 4 MB]
But the citation error is not just in the NCDC webpage, it is in the PDF document that NOAA and/or NCDC wrote up. I can’t be sure since they cite no named author. I had few people point out the existence of the NCDC rebuttal to me in the last week, and I’ve been biding my time. I wanted to see what they’d do with it. Over the weekend I discovered that NOAA had widely circulated NCDCs “talking points” document to top level division managers in NOAA. I was given this actual internal email, by someone whom appears not to agree with the current NOAA/NCDC thinking.
It seems pretty much everyone in management at NOAA got this email, yet a week later the citation error remains. Nobody caught it. I find it pretty humorous that NOAA felt that a booklet full of photographs that many said at the beginning “don’t matter” required an organization wide notice of rebuttal. Note also some big names there. Senior NOAA scientist Susan (1000 year CO2) Solomon got a copy. So did Matt Ocana, Western Region public affairs officer for the National Weather Service. Along with Jeff Zimmerman who appears to be with the NWS Southern Region HQ. The originator, Andrea Bair, is the Climate Services Program Manager, NWS Western Region HQ.
There are lots of other curious things about that NCDC “Talking Points” document.
1. They give no author for the talking points memo. An inquiry as to the author’s name I sent to my regular contact at NCDC a week ago when I first learned of this has gone unanswered. Usually I have gotten answers in a day.
2. They think they have the current data, they do not. They have data from when the network was about 40% surveyed. They cite 70 CRN1/2 stations when we actually have 92 now. Additionally, some of the ratings have been changed as new/better survey information has come to light. They did their talking points analysis with old data and apparently didn’t know it.
3. They never asked me for a current data set. They know how to contact me, in fact they invited me to give a presentation at NCDC last year, which you can read about here in part 1 and part 2
Normally when a scientific organization prepares a rebuttal, it is standard practice to at least ask the keeper of the data if they have the most current data set, and if any caveats or updates exist, and to make the person aware of the issues so that questions can be answered. I received no questions, no request for data and no notice of any kind. This is not unlike NCDCs absurd closing of my access to parts of their station meta database in the summer of 2007 without notice just a few weeks after I started the project.
4. They cite USHCN2 data in their graph, but they can’t even get the the number of stations correct in USHCN2. The correct number from their AMS publication is 1218 stations, they list 1228 on the graph. While the error is a simple one, it shows the person doing the talking points was probably not fully familiar with the USHCN2.
When I was invited to speak at NCDC last year, I had a lengthy conversation with Matt Mennes, the lead author of the USHCN2 method and peer reviewed paper here. What I learned was this:
a) The USHCN2 is designed to catch station moves and other discontinuities. Such as we see in Lampasas, TX
b) It will NOT catch long term trend issues, like UHI encroachment. Low frequency/long period biases pass unobstructed/undetected. Thus a station that started out well sited, but has had concrete and asphalt built up around it over time (such as the poster child for badly sited stations Marysville, now closed by NOAA just 3 months after I made the world aware of it) would not be corrected or even noted in USHCN2.
5. They give no methodology or provenance for the data shown in their graph. For all I know, they could be comparing homogenized data from CRN1 and 2 (best stations) to homogenized data from CRN 345 (the worst stations), which of course would show nearly no difference. Our study is focusing on the raw data and the differences that changes after adjustments are applied by NCDC. Did they use 1228 stations or 1218 ? Who knows? There’s no work shown. You can’t even get away with not showing your work in high school algebra class. WUWT? For NCDC not to cite the data and methodology for the graph is simply sloppy “public relations” driven science. But most importantly, it does not tell the story accurately. It is useful to me however, because it demonstrates what a simple analysis produces.
6. They cite 100 year trends in the data/graph they present. However, our survey most certainly cannot account for changes to the station locations or station siting quality any further back than about 30 years. By NCDC’s own admission, (see Quality Control of pre-1948 Cooperative Observer Network Data PDF) they have little or no metadata posted on station siting much further back than about 1948 on their MMS metadatabase. Further, as we’ve shown time and again, siting is not very static over time. More on the metadata issue here.
While we have examined 100 year trends also, our study focus is different in time scale and in scope. If I were to claim that the surfacestations.org survey represented siting conditions at a weather station 50 or 100 years ago, without supporting metadata or photographs, I would be roundly criticized by the scientific community, and rightly so. We believe most of the effect has occurred in the last 30 years, much of it due to the introducing of the MMTS electronic thermometer into the network about 1985 with a gradual replacement since then. The cable issue has forced official temperature sensors closer to buildings and human habitation with that gradual change. NCDC’s new USHCN2 method will not detect this long period signal change introduced by the gradual introduction of the MMTS electronic thermometer, nor do they even address the issue in their talking points, which is central to the surfacestations project.
7. In the references section they don’t even cite my publication! Yet they cite Mennes USHCN2 publication where the 1218 USHCN2 station number is clearly found.
It seems as if this was a rush job, and in the process mistakes were made and common courtesy was tossed aside. I suppose I shouldn’t be upset at the backlash, after all bureaucrats don’t like to be embarrassed by people like me when it is pointed out what a lousy job has been done at temperature measurement nationwide. I’m working on a data analysis publication with authors that have published in peer reviewed climate an meteorology journals. After learning from John V’s crash analysis in summer 2007 when we had about 30% of the network done, few CRN1/2 stations, and poor spatial distribution that people would try to analyze incomplete data anyway, I’ve kept the rating data and other data gathered private until such time a full analysis and publication can be written.
As NCDC demonstrated, it seems many people just arent willing to wait or to even respect he right to first publication of data analysis by the primary researcher. By not even so much as giving me a courtesy notice or even requesting up to date data, it is clear to me that they don’t think I’m worthy of professional courtesy, yet they’ll gladly publish error laden and incomplete conclusions written by a ghost writer in an attempt to disparage my work before I’ve even had a chance to finish it. This is the face of NCDC today.
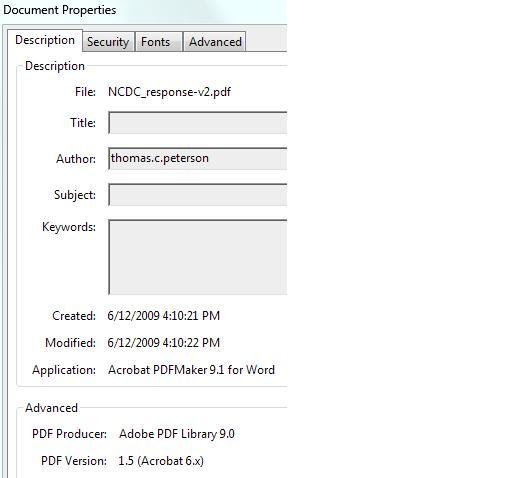
UPDATE: WUWT commenter Scott Finegan notes that Adobe PDF files have a “properties” section, and that the authors name was revealed there. Here is a screencap.