Dec 08, 2008
Rethinking Global Warming
World Climate Report
The United Nations Climate Change Conference is underway this week in Poznan, Poland, and literally thousands of folks have convened and reinforced the notion that the buildup of greenhouse gases has caused substantial warming in recent decades and that left unchecked, the continued buildup will undoubtedly cause significant warming in the decades to come. Believe it or not, it is possible that aspects of the traditional greenhouse gas explanation could be largely wrong, and if you think we are crazy, let’s visit an article just published in the prestigious journal Climate Dynamics. (Compo, G.P. and P.D. Sardeshmukh. 2008. Oceanic influences on recent continental warming. Climate Dynamics, DOI 10.1007/s00382-008-0448-9).
The interesting (to say the least) work was conducted by Gilbert Compo and Prashant Sardeshmukh of the Climate Diagnostics Center, Cooperative Institute for Research in Environmental Sciences and Physical Sciences Division, Earth System Research Laboratory, National Oceanic and Atmospheric Administration (these guys must have oversized business cards) and the work was supported financially by the NOAA Climate Program Office. The first sentence of the abstract reads “Evidence is presented that the recent worldwide land warming has occurred largely in response to a worldwide warming of the oceans rather than as a direct response to increasing greenhouse gases (GHGs) over land.” This sentence certainly captured our interest at World Climate Report - anyone suggesting that some warming may have been caused by something other than the buildup of greenhouse gases will always get a second look.
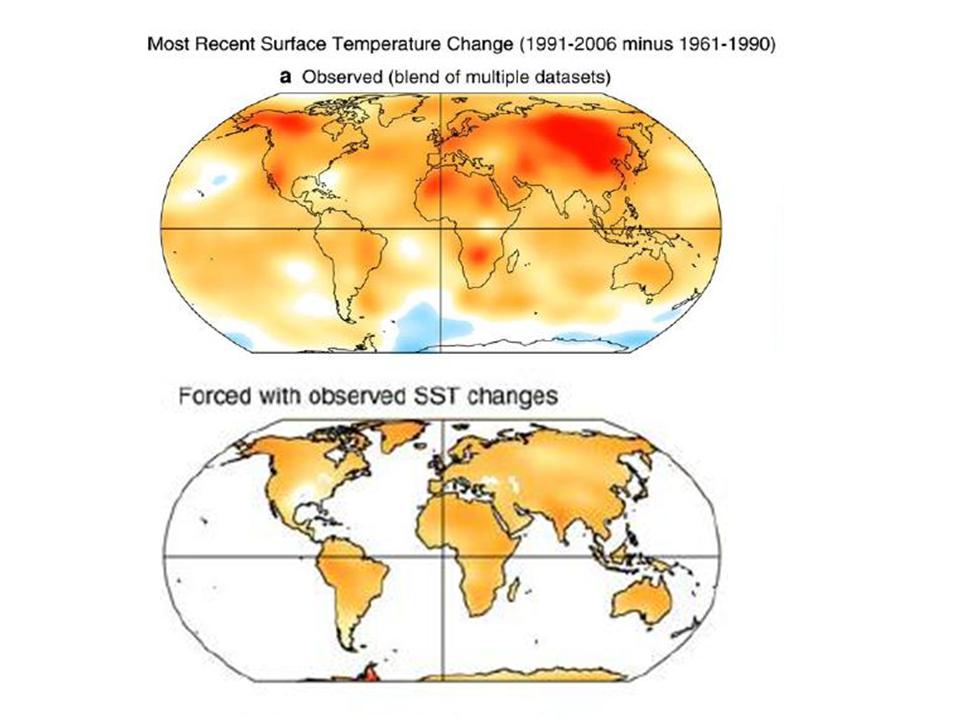
The approach used by Compo and Sardeshmukh is actually quite simple and clever. The pair collected sea surface temperature data from 1961 to 2006 and they determined the difference between the 1991-2006 and 1961-1990 sub-periods. As seen in the Figure 1 below, the oceans of the world generally warmed between the two sub-periods. Next, they took only the change in SSTs to force global climate responses in a suite of climate models. Basically, instead of increasing greenhouse gas (GHG) concentration to examine the global climate response, they wondered how the climate would be impacted by the spatial pattern of sea surface temperature changes over the global oceans. In addition, they conducted a set of numerical modeling experiments that did include the set of known forcings “included time-varying solar irradiance and volcanic aerosols, anthropogenic sulfate aerosols, tropospheric and stratospheric ozone, well-mixed GHGs (CO2, CH4, N2O), halocarbons, and black carbon aerosols.”
In the second sentence of their abstract, Compo and Sardeshmukh tell us “Atmospheric model simulations of the last half-century with prescribed observed ocean temperature changes, but without prescribed GHG changes, account for most of the land warming.” Are they kidding? Are they really suggesting that the warming of the land areas of the Earth may not have been caused directly by the increased concentration of greenhouse gases? The answer is ... yes!
Their figure shows the results and to the amazement of the greenhouse advocates, the model runs forced by SSTs only did as good a job replicating the observed temperature rise as the model runs with elevated greenhouse gases or the many other forcings explored in their research. In explaining their results, the scientists write “In summary, our results emphasize the significant role of remote oceanic influences, rather than the direct local effect of anthropogenic radiative forcings, in the recent continental warming. They suggest that the recent oceanic warming has caused the continents to warm through a different set of mechanisms than usually identified with the global impacts of SST changes. It has increased the humidity of the atmosphere, altered the atmospheric vertical motion and associated cloud fields, and perturbed the longwave and shortwave radiative fluxes at the continental surface.”

See larger image here
Time will tell, but don’t look for a lot of press coverage coming from the Poland meeting of this interesting research challenging the gospel of global warming. Read much more here. This fits what we have been saying for years and most recently here and here.
Dec 04, 2008
The PDO not Greenhouse Gases are Responsible for Climate Changes in Alaska
By Joseph D’Aleo, CCM, Fellow AMS
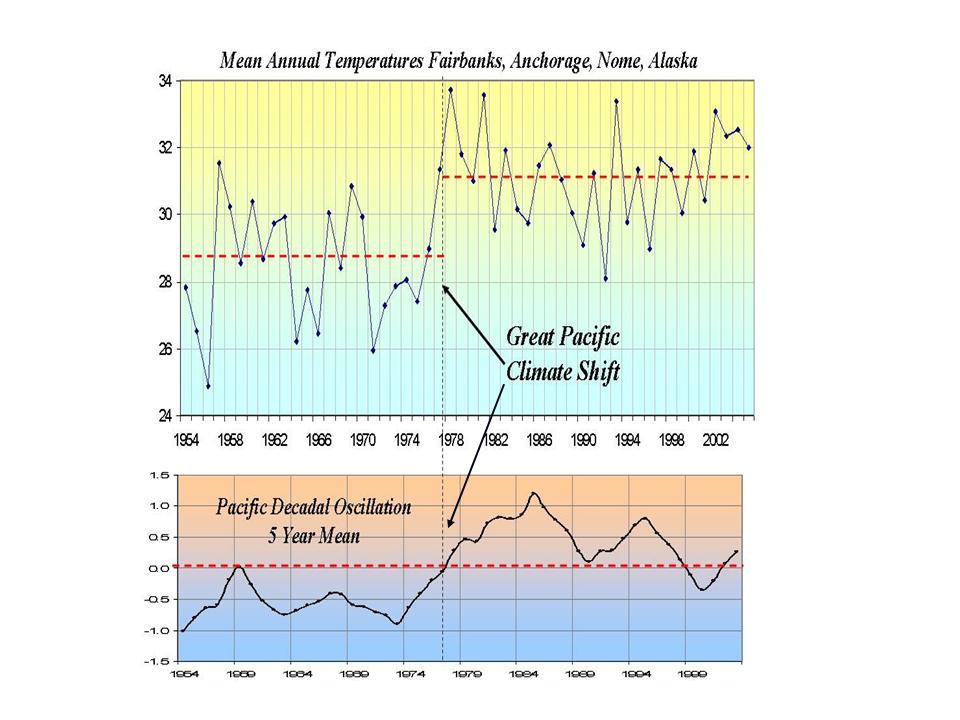
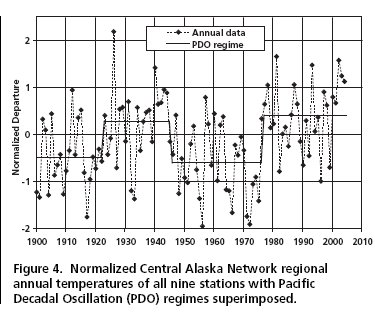
The PDO has a major influence on Alaskan and for that matter global temperatures. The positive phase favors more El Ninos and a stronger Aleutian low and warm water in the north Pacific off the Alaskan coast. The negative phase more La Ninas and cold eastern Gulf of Alaska waters. The combination of a stronger Aleutian low and warm water off the coast leads to warmer temperatures in Alaska in the +PDO phase and a weakened Aleutian low, colder water, colder temperatures in the negative phase.
The PDO flip in 1977 from negative (which correlated with more frequent La Ninas) to positive (with more frequent El Ninos). More frequent La Ninas and weaker El Ninos followed the recent decline. In Alaska, the sudden Great Pacific Climate Shift (from negative to positive PDO) in 1977 led to a step-ladder warming.

We will update this after the annual 2008 temperatures become available in January. See larger image here.
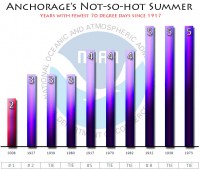
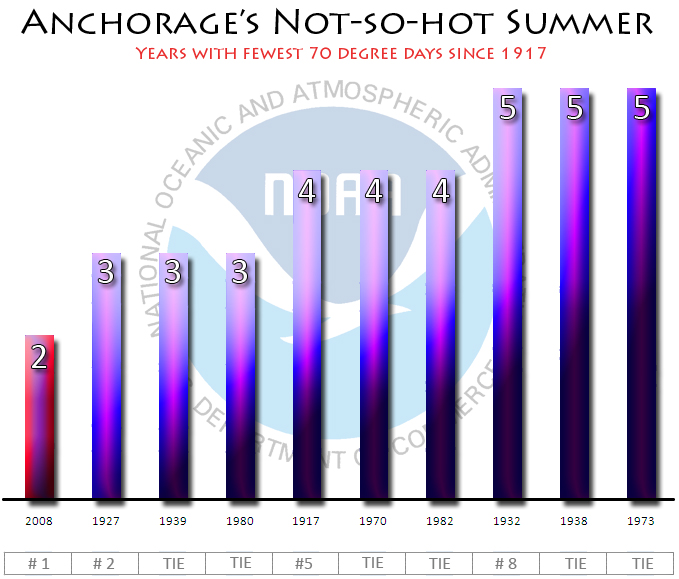
The decline since 1999 and especially since 2007 has led to rapid cooling and heavy snows. Alyeska, Alaska picked up 826” (nearly 70 feet) of snow last snow season. This was followed by an extremely cold summer and a sudden advance of Alaskan Glaciers for the first time in 250 years.
Anchorage reached 65F only 16 times this past summer, tying the record set in 1970 for least 65F days. It broke the record for least 70F days with only 2.
See larger image here
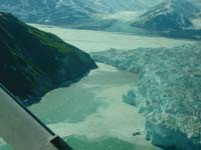
With heavy winter snows and a cold spring and summer, the ice did not melt as much as usual - the result was a net annual advance in Alaskan glaciers.
As Michael Asher reported October 16, 2008 in Daily Tech, Alaskan Glaciers Grow for First Time in 250 years: A bitterly cold Alaskan summer has had surprising results. For the first time in the area’s recorded history, area glaciers have begun to expand, rather than shrink. Summer temperatures, which were some 3 degrees below average, allowed record levels of winter snow to remain much longer, leading to the increase in glacial mass.
And the cold continued this fall. This is part of a statement from the National Weather Service in Fairbanks on November 24th.
...A COLD START TO WINTER THIS YEAR AT FAIRBANKS…
October ended up as the 4th coldest in the last 104 years of weather record at Fairbanks. The total of 13 days with a low temperature below zero was the most since 1965. November has also been much colder than average. Through yesterday ...the average temperatures of -2.3 degrees was 7.3 degrees below the 30-year average. It has been the 8th coldest November in the last 50 years. There have been a total of 20 days So far this month where the temperature has fallen below zero...which is already above the average of 18 days for the entire month. Read more here.
UPDATE: Following this post we received this excellent paper (H/T Richard Keen) ”Monitoring Seasonal and Long-term Climate Changes and Extremes in the Central Alaska Network” by Pamela J. Sousanes that found this same PDO correlation as she demonstrated in this figure:

See larger image here.
Help Icecap do more to show these natural factors drive the climate - please see this letter.
Dec 03, 2008
Are Rising CO2 Levels And The Increase In Atlantic Major Hurricanes Since 1995 Related?
By Dr. William Gray
The official end of the 2008 Atlantic basin hurricane season occurred last Sunday (November 30). This year was an active and destructive season. My colleague, Phil Klotzbach and I were very happy to see that our forecasts for this year’s activity worked out well, as did NOAA’s seasonal hurricane forecast. See our website for a 53-page summary of this season’s activity. Although this is my 25th year of making these seasonal forecasts, Klotzbach should get most of the credit for the success of this year’s forecast.
President-Elect Barack Obama said last week that “storms are growing stronger with each passing hurricane season” (implying that this is due to CO2 increases). He is repeating what Al Gore has been saying for years and what was implied by thousands of media reports after the damaging Atlantic seasons of 2004-2005. Polls have shown that a relatively high percentage of US citizens think that human-induced global warming has increased hurricane activity.
Yes, the Atlantic has seen a very large increase in major hurricanes during the 14-year period of 1995-2008 (average 3.9 per year) in comparison to the prior 25-year period of 1970-1994 (average 1.5 per year). But, have rises in CO2 been, in any way, been responsible for the recent large upswing in Atlantic basin major hurricanes since 1995?
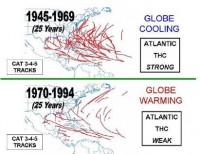
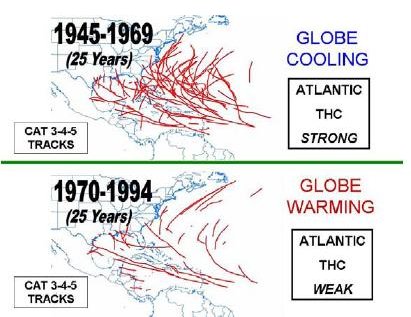
I and a number of my colleagues believe that this large increase in Atlantic major hurricanes is primarily due to the multi-decadal increase in the Atlantic Ocean Thermohaline Circulation (THC) that is driven by Atlantic salinity variations. These Atlantic multi-decadal changes have also been termed the Atlantic Multidecadal Oscillation (AMO). These increases are not a result of global surface temperatures or CO2 increases.
In the quarter-century period from 1945-1969 when the globe was undergoing a weak cooling trend, the Atlantic basin experienced 80 major (Cat 3-4-5) hurricanes and 201 major hurricane days. By contrast, in a similar 25-year period from 1970-1994 when the globe was undergoing a general warming trend, there were only 38 major hurricanes (48% as many) and 63 major hurricane days (31% as many). Atlantic sea surface temperatures and hurricane activity is related to but does not necessarily follow global mean temperature trends.
See larger image here.
See larger image here.
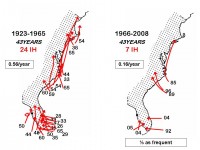
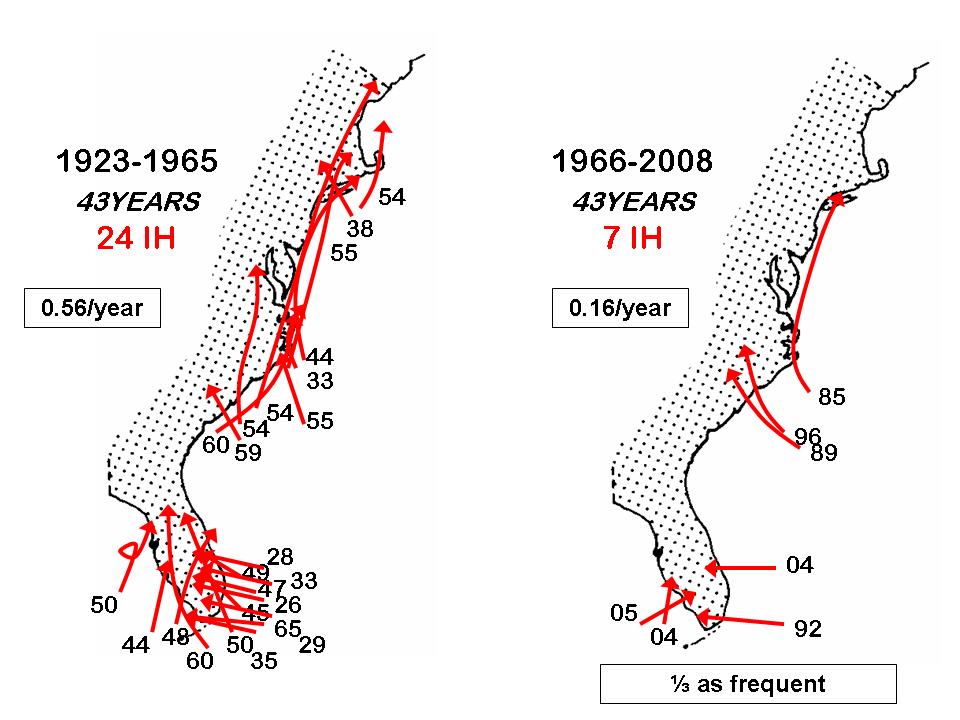
What made the 2004 and 2005 seasons so unusually destructive was not the high frequency of major hurricanes but the high percentage of hurricanes that were steered over the US coastline. Figure belows shows the contrast of the number of tracks of East Coast and Florida Peninsula major landfalling hurricanes during the 43-year period of 1923-1965 versus the most recent 43-year period of 1966-2008. Read full post here.
Nov 29, 2008
Russia Tells Obama: If You Don’t Drill, We Will
By MercoPress, 24 November 2008 [Courtesy CCNet and TWTW]
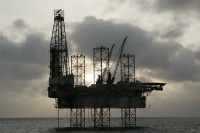
Russian oil companies could soon begin searching for oil in deep Gulf of Mexico waters off Cuba, a top diplomat said just days before Russian President Dmitry Medvedev visits the island. Russian oil companies have “concrete projects” for drilling in Cuba’s part of the gulf, said Mijail Kamynin, Russia’s ambassador to Cuba, to the state-run business magazine Opciones. Kamynin also said Russian companies would like to help build storage tanks for crude oil and to modernize Cuban pipelines, as well as play a role in Venezuelan efforts to refurbish a Soviet-era refinery in the port city of Cienfuegos, according the article published this weekend.
Medvedev comes to former Cold War ally Cuba on Thursday, part of a tour of Latin America to strengthen his country’s economic and political ties in the region. Kamynin said trade between Russia and the island would top 400 USD million this year. Washington’s nearly 50-year-old trade embargo prohibits US companies from investing on the island. But Cuba’s state-run oil concern has signed joint operating agreements with companies from several countries
to explore waters that Cuban scientists claim could contain reserves of up to 20 billion barrels of oil. Read more here.
\
Nov 28, 2008
Gore and the Mayan Civilization Collapse - Gore is Advocating Abandoning IPCC
Richard Mackey, Statistician
"The following appeared on Gore’s website of Nov 19, 2008: Looking Back to Look Forward
A new study suggests the Mayan civilization might have collapsed due to environmental disasters:
“These models suggest that as ecosystems were destroyed by mismanagement or were transformed by global climatic shifts, the depletion of agricultural and wild foods eventually contributed to the failure of the Maya sociopolitical system,’ writes environmental archaeologist Kitty Emery of the Florida Museum of Natural History in the current Human Ecology journal.” As we move towards solving the climate crisis, we need to remember the consequences to civilizations that refused to take environmental concerns seriously. If you haven’t read already read it, take a look at Jared Diamond’s book, Collapse.”

This is a most curious reference.
It means that Gore is advocating the abandonment of the IPCC doctrine and barracking for the study and understanding of climate dynamics that ignores totally the IPCC/AWG doctrine and focuses on all the other variables, especially how climate dynamics are driven by atmospheric/oceanic oscillations, the natural internal dynamics of the climate system and the role of the Sun in climate dynamics.
Brian Fagan in Floods, Famines and Emperors, El Nino and the fate of civilisations, Basic Books 1999, shows that the Maya collapse, whilst having complex political, sociological, technological and ecological factors, was largely driven by the natural atmospheric/oceanic oscillations of ENSO and NAO. The book is one of three by Brian Fagan, Professor of Anthropology UC Santa Barbara, that documents how natural climate variations, ultimately driven by solar activity, have given rise to the catastrophic collapse of civilisations. The book has a chapter on the Mayan civilisation which collapsed around 800 to 900 AD.
Here are some quotes from his book:
“The “Classic Maya collapse” is one of the great controversies of archaeology, but there is little doubt that droughts, fuelled in part by El Nino, played an important role.” “The droughts that afflicted the Maya in the eighth and ninth centuries resulte from complex, still little understood atmosphere-ocean interactions, including El Nino events and major decadal shifts in the North Atlantic Oscillation, as well as two or three decade-long variations in rainfall over many centuries.” Read more here.
|

