UPDATE: A team of scientists and lawyers have filed an AMICUS BRIEF to the SCOTUS after presenting compelling evidence, arguing that in conclusion:
The “triggering” determination at issue here is at the core of EPA’s current program to restrict hydrocarbon based energy and make it more expensive and less available. The Endangerment Finding and subsequent triggering determination came about when Congress failed to pass President Obama’s proposed “cap and trade” legislation during his first term. As described by the President during his 2008 campaign, that legislation was specifically intended to reduce carbon emissions by forcing a massive increase in the price of energy: “Under my plan ... electricity rates would necessarily skyrocket.” Erica Martinson, Uttered in 2008, Still Haunting Obama in 2012, Politico (Apr. 5, 2012, 11:37 PM), http://www.politico.com/news/stories/ 0412/74892.html.
Adding CO2 to the stationary source PSD permitting program seeks to accomplish the same result through forcing the massive closure of coal based power plants (a process already well under way) and hindering and delaying the construction and operation of power sources that use the cheapest forms of energy, which are hydrocarbon based energy. And EPA seeks to achieve that result without new legislation, and instead as a supposed interpretation of over 35-year-old legislation never previously thought to cover this subject matter.
Meanwhile the United States is on the cusp of an energy revolution of hydrocarbons from unconventional oil and natural gas sources that is having the effect of rapidly increasing the supply and decreasing the price of carbon-based energy. See, e.g., America’s New Energy Future: The Unconventional Oil and Gas Revolution and the U.S. Economy, Volumes I, II, and III, IHS (September 2013). IHS sees the energy revolution as adding millions of jobs and hundreds of billions of dollars annually to the U.S. economy, all based on burning hydrocarbon fuels and emitting CO2 into the atmosphere. EPA looks upon this prospect with horror, and the stationary source PSD permitting program coupled with EPA’s plans for CO2 emissions standards is precisely the means it sees available to stop it before it can get too far.
Arbitrarily raising the price of energy is the same thing as purposely impoverishing the American people. It is shocking that our government would intentionally pursue such a goal, particularly without any scientific basis whatsoever to do so, as discussed in Point IV above. It is equally shocking that the executive branch, without supporting legislation, would decide that accomplishing its energy/climate goals, not endorsed by Congress or the general public, is so sacrosanct that it must take a completely inapplicable law and twist it into a pretzel in the desperate but ultimately futile effort to find a basis to raise the price and limit the availability of energy for the American people. And meanwhile CO2 is a worldwide phenomenon, and other countries like China and India have no plans meaningfully to curtail their rapidly increasing emissions. Unilateral CO2 emission control by the United States promises to damage the economy of the United States without any benefits.
In fact, increasing CO2 in the atmosphere facilitates achieving the goal of raising the poor out of poverty through increasing food production. CO2 is the primary “food” utilized by the vast majority of plants to produce the organic matter out of which they construct their tissues, which subsequently become the ultimate source of food for nearly all animals and humans. Consequently, the more CO2 there is in the air, the better plants grow, as has been demonstrated in literally thousands of laboratory and field experiments. See Craig Idso & S. Fred Singer, Climate Change Reconsidered: 2009 Report of the Nongovernmental Panel on Climate Change (NIPCC), Chapter 7 (Chicago, IL 2009). And the better plants grow, the more food there is available to sustain the entire biosphere.
At least since the International Conference on Rising Atmospheric Carbon Dioxide and Plant Productivity of 1983, it has been known that a doubling of the air’s CO2 concentration would likely lead to a 50% increase in photosynthesis and a doubling of water use efficiency in many types of plants, as well as significant increases in biological nitrogen fixation in almost all biological systems, and an increase in the ability of plants to adapt to a variety of environmental stresses.
Availability of potable water for irrigation is a key constraint on food production in the United States and many other countries; yet studies conducted on hundreds of different plant species demonstrate the very real and measurable growth- enhancing, water-saving, and stress-alleviating advantages that rising atmospheric CO2 concentrations bestow upon Earth’s plants. See Craig Idso & S. Fred Singer, Climate Change Reconsidered: 2009 Report of the Nongovernmental Panel on Climate Change (NIPCC), Ch. 7 (2009); Craig Idso & Sherwood Idso, The Many Benefits of Atmospheric CO2 Enrichment (2011).
All these benefits largely flow to those who otherwise struggle to afford an adequate supply of food, in other words, the poor. The bottom line here is that rising atmospheric CO2 levels yield very significant net benefits to society. In making its Endangerment Finding, EPA did not even consider these benefits. That total dereliction of duty calls into question the reasonableness of its entire effort to restrict CO2 under the CAA, and ultimately the reasonableness of the so-called “triggering” rule at issue on this petition. This is particularly true given that each of EPA’s three lines of evidence for its Endangerment finding is demonstrably invalid.
If EPA succeeds in limiting the availability of hydrocarbon based energy and raising its price, it is not the rich who will be priced out of purchasing the energy they need. It is the poor. Cheap carbon-based energy from stationary sources means that relatively low income people in this country can afford, for example, to heat, cool and light their homes, cook meals, use the internet, talk on cell phones, buy products like automobiles made of inexpensive steel and other metals. If the lowest cost energy available is unwisely restricted, all Americans will suffer greatly, but the poorest the first and the most.
Indeed to the extent that this Administration can significantly influence other countries’ energy/ climate policy, it is primarily the poor who would stand to be harmed by decreased availability of affordable food resulting from restriction of the amount of CO2 that would otherwise be in the atmosphere. In seeking to regulate CO2 from stationary sources under the CAA, and in opposing the petitions, EPA would enlist this Court in its campaign that results in such impoverishment. It would be very sad if this Court by its decision went along with this campaign.
CONCLUSION
The judgment of the Court of Appeals should be reversed. In addition EPA’s Endangerment Finding should be vacated.
---------
Majority rules on climate science?
Jeff Jacoby, Boston Globe
BACK IN 2006, around the time Al Gore’s global-warming documentary, “An Inconvenient Truth,” was released, I started a file labeled “What Climate Consensus?” Gore was insisting that “the debate among the scientists is over,” and only an ignoramus or a lackey for the fossil-fuel industry could doubt that human beings were headed for a climate catastrophe of their own making. But it didn’t take much sleuthing to discover that there was plenty of debate among scientists about the causes and consequences of global warming. Many experts were skeptical about the hyperbole of alarmists like Gore, and as I came across examples, I added them to my file.
The thicker that file grew, the more shrilly intolerant the alarmists became.
Over and over the True Believers insist that their view is not just widely accepted in the scientific community, but virtually unanimous apart from some crackpots. Rajendra Pachauri, chairman of the UN’s Intergovernmental Panel on Climate Change, has likened doubters to members of a Flat Earth Society. CBS news reporter Scott Pelley, asked why his “60 Minutes” broadcasts on global warming didn’t acknowledge the views of skeptics, reached for an even more wounding comparison: “If I do an interview with Elie Wiesel, am I required as a journalist to find a Holocaust denier?”
It seems to make no difference that those challenging the doomsday narrative include some of the world’s most distinguished scientists, or that numerous experts in climatology and related earth sciences have repeatedly gone public with their critiques. To climate ideologues, they’re invisible. “Ninety-seven percent of scientists agree: #climate change is real, man-made and dangerous,” President Obama tweeted in May.
Really? That’s not what the American Meteorological Society learned from a recent survey of its professional members. Only a bare majority, 52 percent, said that climate change is largely being driven by human activity. Scientists with a “liberal political orientation” were much more likely to regard global warming as human-caused and harmful, the survey’s authors found - in fact, as a predictor of respondents’ views on global warming, ideology outweighed greater expertise. “This would be strong evidence against the idea that expert scientists’ views on politically controversial topics can be completely objective,” the authors observe.
In that light, consider the findings of a new study published in the journal Nature Climate Change. Of 117 global warming predictions generated by climate-model simulations, all but three “significantly” overestimated the actual amount of warming that occurred during the past 20 years. The models typically forecast that global surface temperature would rise by more than twice as much as it did.
Why would so many scientists have relied on models that turned out to be so wrong? The authors propose several plausible explanations - volcanic eruptions? solar irradiation? - but their bottom line is that climate science still has a long way to go: “Ultimately the causes of this inconsistency will only be understood after . . . waiting to see how global temperature responds over the coming decades.”
That understanding won’t be advanced one millimeter by ideologues who thunder that the “science is settled.” Perhaps all those climate models wouldn’t have been programmed to overpredict global warming if the pressure to conform to the alarmists’ view weren’t so pervasive.
In a classic 1955 lecture on “The Value of Science,” the celebrated physicist (and future Nobel laureate) Richard Feynman warned that science would be hobbled if it tried to stifle its doubters and skeptics. “If we want to solve a problem that we have never solved before, we must leave the door to the unknown ajar ... [D]oubt is not to be feared but welcomed and discussed.”
Science isn’t settled by majority vote, and invoking “consensus” to shut off debate is authoritarian and anti-scientific. There are always inconvenient truths to challenge what the majority thinks it knows. Ninety-seven percent of experts may be impressed with the emperor’s new clothes. That’s no reason to silence those who insist the emperor is naked.
CNSNews.com) The number of Americans who think “dealing with global climate change” should be a top U.S. foreign policy goal continues to fall in a poll that has tracked the issue since the 1990s, and five years under an administration more inclined to make it an issue does not appear to have stemmed the slide.
The latest Pew Research Center poll surveying Americans’ foreign policy goals also found a significant partisan difference when it comes to the importance of prioritizing climate change.
Out of 11 foreign policy goals featured in the poll released Wednesday, climate change ranks fourth from the bottom, with 37 percent of respondents saying it should be a top priority. That has dropped slowly but steadily from 50 percent in 1997, to 44 in 2001, 43 in 2005 and 40 in 2009.
Of the other goals, “protecting U.S. from terrorist attacks” and “protecting U.S. jobs” get the most support, at 83 and 81 percent respectively, while “promoting democracy in other nations” gets the least, at 18 percent.
Unlike the climate change goal’s downward movement, most of the others have risen and fallen in importance at various times over the years of polling, although “reducing dependence on imported energy” has dropped since 2005 (from 67 to 61 percent) and “promoting democracy in other nations,” after climbing from 1997 to 2001 (from 22 to 29 percent), has dropped steadily ever since.
The other goals featured are “preventing the spread of weapons of mass destruction” (73 percent in 2013) “combating international drug trafficking” (57 percent), “reducing illegal immigration” (48 percent), “strengthening the United Nations” (37 percent), “promoting and defending human rights in other countries” (33 percent) and “helping improve living standards in developing nations” (23 percent).
Pew also tracked the differences between Republicans’ and Democrats’ views on the 11 foreign policy goals, and found that the widest gap - a difference of 41 points applies to climate change: Fifty-seven percent of Democrats, and only 16 percent of Republicans, believe it should be a U.S. foreign policy priority.
The next biggest partisan gaps relate to strengthening the U.N. (50 percent Democrats vs. 25 percent Republicans) and illegal immigration (62 percent Republicans vs. 38 percent Democrats).
An earlier Pew poll found that Republicans associated with the tea party account for most of the skepticism about global warming: Just 25 percent of tea party Republicans agreed there was “solid evidence the earth is warming” compared to 61 percent of non-tea party Republicans. Eighty-four percent of Democrats shared that belief.
But even among the non-tea party Republican respondents in that survey, only 32 percent said human activity was to blame, while 24 percent attributed warming to “natural patterns.”
Overall, fewer than half of the respondents of all political persuasions (44 percent) believed human activity is to blame.
The continuing downward trend in prioritizing climate change in foreign policy comes despite the fact that President Obama has, in the words of Secretary of State John Kerry, placed the issue “back on the front burner where it belongs.”
Attributing climate change to human activity is a view strongly held by senior administration officials. Kerry himself, who as a senator was an outspoken advocate, has prioritized the issue of human-induced global warming as America’s top diplomat. He recently declared himself “amazed” that some Americans do not recognize the urgency of climate change “for life itself on the planet as we know it.”
His predecessor at the State Department, Hillary Clinton, said in May 2011, “there is no doubt, except among those who are into denying the facts before their eyes, that climate change is occurring, and it is contributed to by human actions at every level.”
In its most recent report, released last September, the U.N. Intergovernmental Panel on Climate Change (IPCC) concluded that global warming is “unequivocal” and that it is “extremely likely” that human activity has been the main cause.
That was stronger language than appeared in the IPCC’s previous report, in 2007, which asserted that global warming was “very likely” man-made.
A year ago, a peer-reviewed journal published the results of a survey of more than 1,000 professional engineers’ and geoscientists’ views on climate change, and found that only 36 percent fitted into a group that “express[ed] the strong belief that climate change is happening, that it is not a normal cycle of nature, and humans are the main or central cause.”
“They are the only group to see the scientific debate as mostly settled and the IPCC modeling to be accurate,” the survey found.
The rest of the respondents, with slight variations, expressed varying degrees of skepticism about the causes of climate change, the extent of risk it poses, and the accuracy of IPCC modeling.
The believers, members of the Church of Climate Scientology of course tend not to pay any attention actual data but believe their idealogue leaders, the models and their all too compliant leftist media. You can usually pick them out at the beach.
The debate on the social cost of carbon is heating up.
White House
The White House has recently issued a Technical Support Document on the Social Cost of Carbon [link. Excerpts from the Executive Summary:
The purpose of the “social cost of carbon” (SCC) estimates presented here is to allow agencies to incorporate the social benefits of reducing carbon dioxide (CO2) emissions into cost-benefit analyses of regulatory actions that impact cumulative global emissions. The SCC is an estimate of the monetized damages associated with an incremental increase in carbon emissions in a given year. It is intended to include (but is not limited to) changes in net agricultural productivity, human health, property damages from increased flood risk, and the value of ecosystem services due to climate change.
The SCC estimates using the updated versions of the models are higher than those reported in the 2010 TSD. By way of comparison, the four 2020 SCC estimates reported in the 2010 TSD were $7, $26, $42 and $81 (2007$). The corresponding four updated SCC estimates for 2020 are $12, $43, $65, and $129 (2007$). The model updates that are relevant to the SCC estimates include: an explicit representation of sea level rise damages in the DICE and PAGE models; updated adaptation assumptions, revisions to ensure damages are constrained by GDP, updated regional scaling of damages, and a revised treatment of potentially abrupt shifts in climate damages in the PAGE model; an updated carbon cycle in the DICE model; and updated damage functions for sea level rise impacts, the agricultural sector, and reduced space heating requirements, as well as changes to the transient response of temperature to the buildup of GHG concentrations and the inclusion of indirect effects of methane emissions in the FUND model.
The Hill
The controversy surrounding this issue is reported today in a post by The Hill. Excerpts:
The White House will seek new public comment on the “social cost of carbon” (SCC), a metric that helps regulators estimate the benefits of rules that cut greenhouse gas emissions.
The Office of Management and Budget (OMB) decision arrives amid criticism from industry groups and Republicans who say the Obama administration’s May 2013 upward revision of the SCC earlier lacked public input.
The “social cost of carbon” has lately been a flashpoint in wider political and lobbying battles over White House’s climate change policy, especially planned Environmental Protection Agency carbon standards for power plants.
Howard Shelanski, the top White House regulatory official, said in a blog post late Friday afternoon that the administration was making new changes to the estimate, and would launch a public comment period “in response to public and stakeholder interest.”
Business groups, such as the Chamber of Commerce and the American Petroleum Institute, have been challenging the revised estimate on various fronts.
In addition, the GOP-led House recently passed a bill that would prevent the EPA from using the metric in major energy rules.
Background info
The Yale Forum on Climate Change has a good post SCC, Social Costs of Carbon: Continuing a little told story. This article provides a lot of good background information. Another good background post is at CSIS.
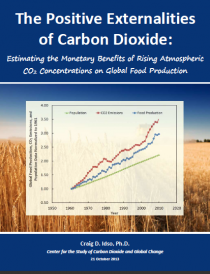
It is clear from the material presented in this report that the modern rise in the air’s CO2 content is providing a tremendous economic benefit to global crop production.
The very real positive externality of inadvertent atmospheric CO2 enrichment must be considered in all studies examining the SCC; and its observationally-deduced effects must be given premier weighting over the speculative negative externalities presumed to occur in computer model projections of global warming. Until that time, little if any weight should be placed on current SCC calculations..
Another contrary view is provided by Media Matters WSJ Contradicts Experts on Social Cost of Carbon. Punchline:
WSJ Editorial Suggests There Should Be No Social Cost Of Carbon. In an editorial, The Wall Street Journal criticized the Obama administration for raising the social cost of carbon, or the estimate of the damages caused by emitting a ton of carbon dioxide in one year, which is used by regulatory agencies to calculate the benefit of reducing carbon emissions.The Journal suggested that the social cost of carbon should be $0, approvingly citing the previous lack of a social cost for carbon, adding that “Congress has never legislated that there are social costs to carbon emissions” and claiming that assigning such as cost is an “inventio[n]” to “ri[g] the rule-making”:
JC comment: The bottom line seems to be that SCC is being established as a surrogate for a National Carbon Tax. My reaction to all this is that it seems like the uncertainty in SCC is colossal, I am not convinced that we should even have confidence in the sign of the SCC in light of the SPPI and WSJ analyses. And the White House is presenting values of SCC with two significant figures? Uncertain T. Monster is not pleased. There has been no attempt to propagate uncertainty through the FUND, DICE and PAGE models, not to mention whatever front end assumptions about carbon and climate are being used as inputs.
And even if we did have confidence in the SCC numbers, the policies evolving around the SCC seem quite convoluted and who knows how they would even play out at achieving the larger policy objectives.
And finally, I return to the issues raised in the preceding post, 20 tips for interpreting scientific claims. Some commenters seemed to think this was pretty much kindergarten stuff and of course policy makers (or their staffers) understand this stuff. Well anyone taking seriously the White House’s SCC numbers needs to go back to kindergarten and pay attention to the 20 tips.
In light of the importance of SCC to U.S. climate/energy policy, it seems that much more attention needs to be paid to this issue.
Business must lobby governments to fight climate change, according to the United Nations. On November 14th as part of the current Warsaw climate conference, the UN issued a new report titled, “Guide for Responsible Corporate Engagement in Climate Policy,” urging active business participation in the UN climate crusade. But is this the best course for business to serve customers and protect the environment?
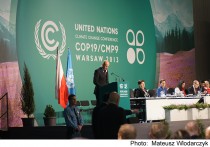
Representatives from more than 190 nations are meeting in Poland, to lay the groundwork for a binding agreement on greenhouse gas emissions by 2015. The tough issues include the size and timing of emissions cuts and contributions to the $100 billion climate fund, to be paid annually to developing nations in 2020. But negotiations are not going well.
China surpassed the United States in 2007 as the largest emitter of greenhouse gases, but does not want to rein in emissions. India has 300 million people without access to electricity and wants other nations to make cuts. Developing nations demand that industrialized nations make deep emissions cuts and large contributions to the $100 billion climate fund, for past emissions sins. Industrialized nations are reluctant to pursue further emissions reductions without participation from developing nations.
Since the failure at the 2009 Copenhagen Climate Conference, global climate negotiations have been adrift. The Kyoto Protocol expired at the end of 2012 without a follow-on emissions treaty. The UN Framework Convention on Climate Change and other organizations blame corporate influence as “a major stumbling block to progress on global climate change initiatives.”
The new UN report on corporate engagement will be highlighted in a special session of the conference on November 19. The report calls for companies to lobby governments to support a “global legal agreement on climate change.” Firms must push for a “carbon price throughout the global economy.” But last week, new Australian Prime Minister Tony Abbott introduced a bill to repeal that nation’s hated carbon tax, a major setback for international efforts.
The report was produced for the UN by leading environmental groups, including the World Resources Institute, the Carbon Disclosure Project, the World Wildlife Fund (WWF), Ceres, and The Climate Group. All of these organizations receive major funding from companies who strive to be responsible corporate citizens.
For example, for many years Coca-Cola has funded the environmental efforts of the WWF. The company runs the “Arctic Home” promotional campaign, featuring a white Coca-Cola can with an image of a mother polar bear and her cubs, raising over $3 million to date for the WWF. Children all over our nation are breaking piggy banks to send money to save the bears.
In 2007, the US Geological Survey published a 30year detailed study of polar bear populations on the north coast of Alaska, using bear capture, tagging, and electronic collaring to track bear populations. The study concluded that, although ice had declined 30 percent in the region over the period, bear populations increased by 30 percent. So both the polar bears and the WWF are doing quite well. Icecap: We recommend boycotting the WWF fund chosen early on by the ‘movement’ because everyone loves animals to funnel funds to help sell the scam. If any corporations recommend a carbon tax we will undertake a boycott campaign against them.
To be good citizens, some companies are voluntarily buying electricity from expensive wind and solar sources. Shareholders accept this profit-reducing activity, believing this contributes to slowing man-made global warming. But according to the International Energy Agency, wind and solar supply less than one percent of global energy needs, and coal-fired energy is growing.
Last week, Japan announced that it was changing its national 2020 emissions target from a decrease to an increase from the year 1990. Both Japan and Germany replaced nuclear plants with coal-fired plants in the wake of the Fukishima nuclear disaster, so emissions for both nations are growing.
In 2011 UPS began using biodiesel at major US shipping hubs. The company stated, “This project helps us reduce our dependence on fossil fuels with the added benefit that it will also reduce air pollution and carbon emissions.” But mounting evidence shows that business use of biodiesel is negative for both people and the environment.
A recent study by the International Food Policy Institute concludes that current biofuel policies do not reduce CO2 emissions. United Kingdom’s Chatham House points out that biofuel efforts increase “the level and volatility of food prices, with detrimental impacts on the food security of low-income food-importing countries.” Rain forests are being replaced in Malaysia and Indonesia with palm oil plantations for biofuel
Since climate change is dominated by natural, not man-made factors, there is no United Nations agreement that will have a measureable effect on Earth’s climate. There is no corporate policy that will have a measurable effect on icecap size, sea level rise, the frequency or intensity of hurricanes or storms, droughts, or floods. No UN policy, however broadly endorsed by nations and companies, will have a measurable effect on global temperatures.
For a real difference and not just a public relations difference, companies should direct efforts toward measures that solve real problems. Innovative products and services for humankind, reduction of real pollutants (not carbon dioxide), and support for efforts to bring electricity, clean water, sanitation, health care, and prosperity to developing nations should be corporate goals, rather than futile efforts to halt climate change.
Steve Goreham is Executive Director of the Climate Science Coalition of America and author of the book The Mad, Mad, Mad World of Climatism: Mankind and Climate Change Mania.
As part of a campaign to pressure CNBC to improve its climate change coverage, mobile billboards are circulating the financial districts of New York City and Chicago on Thursday and Friday. However, rather than airing accurate information on how prominent business leaders use climate science to optimize their risk management strategies, CNBC has continued to air people denying climate change entirely.
The campaign by Media Matters, Forecast the Facts, and Environmental Action was hosted on fuel-efficient trucks to highlight Media Matters’ studies finding that the majority of CNBC’s relevant coverage casts doubt on the basic scientific consensus that climate change is real and manmade. So far, CNBC has not shown any signs of improvement—even after a 45,000-signature petition called on CNBC to improve its coverage.
Most recently, CNBC hosted Joe Bastardi, whose arguments for climate change denial have been called “utter nonsense,” “very odd” and “simply ignorant” by scientists, to discuss Super Typhoon Haiyan. When another meteorologist noted that rising sea levels have worsened the damage from storms such as Haiyan, Bastardi—who has claimed contrary to basic physics that carbon dioxide “literally cannot cause global warming”—predictably dismissed the greenhouse gas connection:
PAUL WALSH, WEATHER CHANNEL: I wouldn’t say that climate change is a direct contributor to these—that’s something that’s still being discussed. But one of the things that makes these storms, especially here for the U.S. and along the east coast, more potentially devastating is the fact that sea levels are rising and expected to continue to rise—and then even smaller storms could have a really, really big impact.
JOE BASTARDI: Well Paul, sea level rise in the Atlantic could be a product of the warm Atlantic Multi-decadal Oscillation. We’ll see what happens when we get out of that. I also want to say, when the Asian continent began cooling, the Pacific ramped up because there’s hyper-period at the end a lot of times in the Pacific when there’s been a lack of activity through the years.
Once again, scientists with expertise in the area handily rebutted Bastardi’s armchair climate science. When asked in an email from Media Matters whether Bastardi’s claim that the rise in sea level rise in the Atlantic was just natural is true, Kevin Trenberth, a distinguished senior scientist at the National Center for Atmospheric Research, responded:
No, global sea level rise is unequivocally related to extra energy coming into the Earth. Sea level cannot rise for no reason. It rises from expansion as the ocean warms and from adding water from melting land ice (glaciers, Greenland etc). Now regionally sea level can rise if it goes down somewhere else. Perhaps Bastardi is confused about that. So there are some places where sea level goes up more than the global mean and some where it is less, but the global mean is unequivocally associated with warming.
Princeton University Geosciences Professor Michael Oppenheimer added via email to Media Matters that “Natural variations can add or subtract from sea level rise but the long term trend is largely due to global warming.”
CNBC host Joe Kernen also rebuked a utility CEO for his efforts to protect consumers from for climate-related impacts earlier this month. Kernen suggested, contrary to preeminent insurance companies, that it is “not necessary” to prepare for the increases in certain weather extremes.
ICECAP NOTE: My friend Joe is right and the formerly distinguished (former because he sold his soul to the IPCC and extreme left AGW church of climate scientology) and ‘Dr’. Oppenhemier, formerly of the the Environmental Defense Fund are once again wrong. JB would run rings about both of these clowns in a debate with real data. The story spinner with MM also purposely misinterpreted what JB said. He never claimed that all the sea level rises are due to the AMO but only that the warming exaggerates the rises there like the Pacific PDO cooling has accelerated reductions of sea level near Alaska. AND sea level rise has slowed to 4 inches to 7 inches a century. These show that Trenberth’s theory the heat is playing ‘WHere’s Waldo’ by hiding in the deep oceans, as heat content increase would cause ocean expansion and increase rises rather than decrease them. See more on that here. Joe Kernan is a great reporter with a very impressive background (Kernen was vice-president at both EF Hutton and Smith Barney. He has a bachelor’s degree from the University of Colorado in molecular, cellular and developmental biology as well as a master’s degree from Massachusetts Institute of Technology. During his graduate studies, he worked at the MIT Center for Cancer Research, one of the world’s premier institutions. His work focused on mouse erythroleukemia cells and resulted in a series of publications in well-known scientific journals including CELL, Developmental Biology and Cold Spring Harbor Symposia on Quantitative Biology) and his assessment this is all political is exactly right and should continue to voice his opinion. Please send letters to CNBC in his support and comment to Media Matters about their cluelessness on climate and most other issues.
----------
Government sponsored corrupt science at the Universities
The following is an email exchange among real ‘honest’ climate scientists from the Pacific Northwest addressing the issue of the corruption like that seen at UCSD and Scripps Oceanographic, once a great institution in the days of Jerome Namias:
October 2013, averaging -2.9 deg F below normal, was the 11th coldest October out of the past 119 years in Oregon. And Oregon’s coldest October was in 1919, followed by 1946, 1949, and 1912 with the warmest being 1988 followed by 1907, 1952, and 1901.
Where is the correlation with CO2? The answer could not be more clear.
The correlation is wherever and whatever it needs to be in order to perpetuate the notion. It can be imagined, fabricated, supposed, presumed or even hiding but magically known to be.
The notion of AGW must not die. For if it were to die the worst kind of mass extinction would quickly follow. The extinction of the corrupt climate calamity peddlers and charlatan pushers of government policy elixirs.
These purposefully mendacious meddlers view the bulk of humanity and society as inferior and in perpetual ailment that demands their limitless intervention and control.
So absolute and overwhelming is their instinct to dominate, that they cannot foresee any scenario of net detriment regardless of how horrifically wrong they are on anything.
Being wrong just does not matter at all, period. When THAT resides in one’s core evidence is always subordinate to desire.
...
You have captured the essence of the climate controversy: corruption. Science is supposed to be synonymous with objective truth, scientist with honesty. Nothing seems further from reality today. Too many scientists are trading on the past history of science where the Scientific Method led to great advancements in human knowledge. Today we have a look-alike called ‘Simulated Science’ where large numbers of technically educated people churn out the mediocre to the nonsensical at the behest of an Establishment happy with predictable propaganda. If it looks like science, it is good enough for them. If a few courageous dissenters raise objections, It is easy to ignore them or point to authority and consensus. The general public is unaware that authority and consensus have no place in science.
All it took was opening up the Federal Treasury. Total honesty melted away in the face of cold cash. And it did not take that much, as Oregon State University professor of climate alarm Phil Mote has pointed out. Most team players are not getting wealthy, but many are able to secure prestigious jobs with ample salaries. All they need do is go along, keep quiet about doubts, and never ask probing questions in public. In return, they live happily ever after. What could be more ideal, for them?
Now some are promoting a ‘carbon tax’ as official affirmation of a ‘climate crisis’ and as a source of the fuel that keeps it all going - cash. Today’s Oregonian featured a call for such a tax from ‘scientists’ at Scripps Institute of Oceanography in California. That institution has become a particular hotbed of climatism, where all have apparently sold their souls for a few more years of good luck.
Science is the one great hope of mankind. Corrupt science is not.