Sep 30, 2013
17 Year Warming Hiatus Causes Panic Cover Up. IPCC Duplicity Continues.
Dr Tim Ball
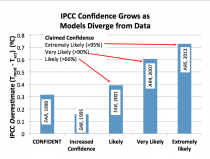
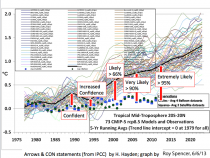
UPDATE: See Howard Hayden’s graphics showing how the iPCC confidence grew as the divergence of forecast from reality increased.
Enlarged
Enlarged
“It occurred to me...” every saying has a contradictory saying except “ignorance is bliss”. If an honest man is wrong, after demonstrating that he is wrong, he either stops being wrong or he stops being honest.
Anonymous
T H Huxley said,
“The great tragedy of science - the slaying of a beautiful hypothesis by an ugly fact.”
The tragic fact is that global temperature has declined slightly for 17 years while CO2 levels increased. The Intergovernmental Panel on Climate Change (IPCC) hypothesis said that if CO2 increased temperature would increase. The hypothesis is slain.
Instead of acknowledging the hypothesis is wrong, as science requires, the defenders advance bizarre explanations none of which bear examination. According to the IPCC what is happening can’t happen. They were over 90 percent certainty of their results and planned to increase that certitude to 95 percent in their next Report (AR5).
Defenders are making ludicrous and contradictory claims to explain what is happening. They said they were 90+ percent certain warming since 1950 was due to human CO2 with natural causes of little or no consequence. Now they’re saying the lack of warming of the last 17 years is because of natural variability and decreasing solar activity.
The sad thing is leaked emails revealed they knew all along that the evidence doesn’t support what they were saying. In October 2009 Kevin Trenberth, a major architect in the IPCC deceptions, wrote,
“Well I have my own article on where the heck is global warming?...The fact is that we can’t account for the lack of warming at the moment, and it is a travesty that we can’t. The CERES data published in the August BAMS 09 supplement on 2008 shows there should be even more warming: but the data are surely wrong. Our observing system is inadequate.”
Notice his explanation in the last sentence. He acknowledged this paucity in 1995 following the Release of a study on weather data by the National Research Council. He said,
“It’s very clear we do not have a climate of the serving system. This may be a shock to many people who assume that we do know adequately what’s going on with the climate, but we don’t.”
The amount of data has decreased since that time Despite this he worked with the IPCC building computer models that are totally dependent on the amount and accuracy of the data. Despite this he signed the Bali Declaration that said in part,
“The 2007 IPCC report, compiled by several hundred climate scientists, has unequivocally concluded that our climate is warming rapidly, and that we are now at least 90% certain that this is mostly due to human activities.”
Take note of the signatures, because one day we must hold these people accountable.
Trenberth was among the first to defend against the contradictory evidence. He did what was standard practice in the cover ups, provide a response for the media. It is particularly helpful if it cannot be verified or is so remote or arcane that nobody can definitively reject it. He and fellow NCAR employee John Fasullo published a paper suggesting the heat was being stored in the deep oceans. The limitations of this claim are already available. As Anthony Watts writes,
“My question is; show me why some years the deep ocean doesn’t mask global warming.”
Another claim, also made by a senior IPCC member, says 17 years is inadequate to determine anything, a minimum of 30 years is required. The 30 year claim is another of the diversions created in climatology for one purpose, but misused for another. Years ago when people were trying to reconstruct conditions for periods in the past the World Meteorological (WMO) decide that a modern period of instrumental record was required for comparison. It became known as the 30-year Normal. Sadly, it was misused and became a representative for the total instrumental record. For example, in most cases when they say, it was above normal today, they are talking about being above the 30 year normal.
They chose 30 years because 30 is considered a statistically representative sample size (small n) for any population (large N). The WMO calculated the first 30 year normal for 1931 to 1960 because that was the first period they considered they had adequate instrumental data. They have changed the Normal ever since on the assumption the record has improved since which is false. The latest is the period 1981 to 2010 The problem is they have reduced the number of stations since 1960 and especially after 1990.
Apart from those limitations, the length of the record is also a diversion. All of the IPCC projections have temperatures increasing. IPCC science assumes the temperature must increase if CO2 increases. According to their science, regardless of the length a decline is virtually impossible. But this where their duplicity catches up with them. The Science Report outlines the serious limitations of their work, but the Summary for Policymakers (SPM) tells generally uninformed media and public a very different story. The scientists knew of this duplicity, some as Lead Authors were involved in both.
They were the ones that convinced the media and the public of the certainty of their science. As David Wojick, UN IPCC expert reviewer, explained
“...What is systematically omitted from the SPM are precisely the uncertainties and positive counter evidence that might negate the human interference theory. Instead of assessing these objections, the Summary confidently asserts just those findings that support its case. In short, this is advocacy, not assessment.”
The IPCC process, methods and science are complete failures. They cannot be restructured because they began with a deliberately narrow definition of climate change. The IPCC must be eliminated and national weather bureaus, who make up most of the membership, should stop doing research. Research by a bureaucrat is almost guaranteed to be political, nowhere is that more evident than in the IPCC failures. It is exposed by the ugly fact that destroyed their hypothesis.
Sep 27, 2013
Urban Heat Island - could it account for much of the century scale warming attributed to AGW?
Joseph D’Aleo, CCM
Boston, Massachusetts Heat island
UPDATE: Jim Steele has posted this analysis on Watts Up With That that supports the notion that urbanization/bad siting/land use is responsible for much of the warming the last century significant cooling of the early century has elevated the apparent warming of recent decades.
The EPA admits to the Urban Heat island and suggests it will augment AGW by increasing the warmth in the cities. They never imagine that maybe man made warming is mostly UHI/bad siting, land use changes. Here is what the EPA says about UHI:
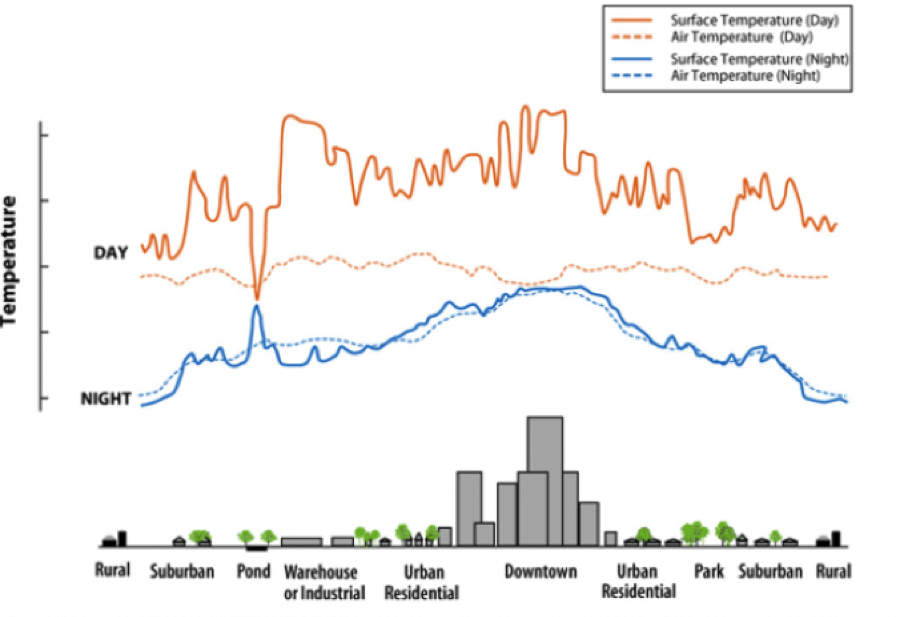
Heat island refers to urban air and surface temperatures that are higher than nearby rural areas. Many cities and suburbs have air temperatures that are 2 to 10 Fahrenheit (1 to 6 Celsius) warmer than the surrounding natural land cover.
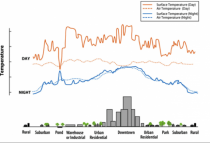
Figure 1 shows a city’s heat island profile. It demonstrates how urban temperatures are typically lower at the urban-rural border than in dense downtown areas. The graphic also show how parks, open land, and bodies of water can create cooler areas].
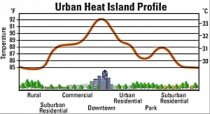
Figure 1. Heat island profile. (Source: U.S. EPA) Enlarged
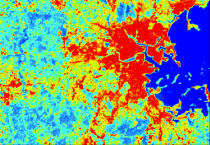
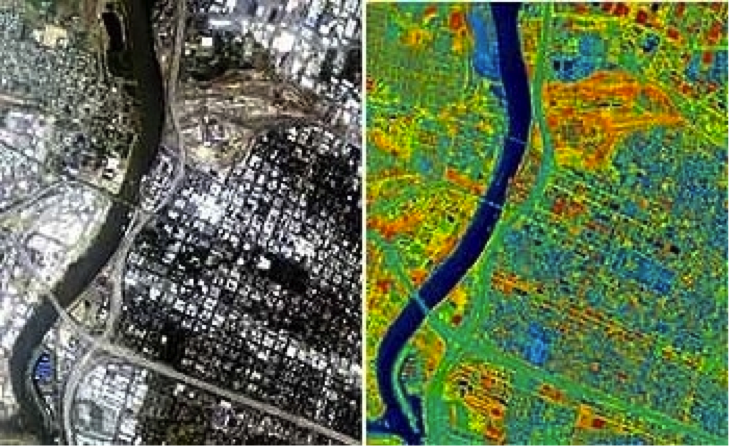
The remotely sensed image of Sacramento, California in Figure 2 illustrates the heat island phenomenon. In the aerial photo (left), the white areas, mostly rooftops, are about 140 degrees Fahrenheit (60 degrees Celsius) and the dark areas, primarily vegetative areas or water, are approximately 85-96 degrees Fahrenheit (29-36 degrees Celsius).
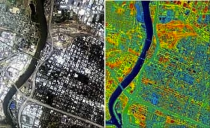
Figure 2. Thermally-sensed image of Sacramento. (Source: U.S EPA) Enlarged
The hottest spots are the buildings, seen as white rectangles of various sizes. In the thermal image (right), Sacramento’s rail yard is the orange area east of the Sacramento River, which flows from top to bottom. Red and yellow areas indicate hot spots and generally correspond with urban development, while blue and green areas are cool and generally correspond to the natural environment.
Cities in cold climates may actually benefit from the wintertime warming effect of heat islands. Warmer temperatures can reduce heating energy needs and may help melt ice and snow on roads. In the summertime, however, the same city may experience the negative effects of heat islands.
Causes of heat islands
The reason the city is warmer than the country comes down to a difference between the energy gains and losses of each region. There are a number of factors that contribute to the relative warmth of cities:

Figure 3. Urban ‘canyons’ contribute to heat islands. (Source: PD Photo.org)
During the day in rural areas, the sunlight absorbed near the ground evaporates water from the vegetation and soil. Thus, while there is a net solar energy gain, this is compensated to some degree by evaporative cooling. In cities, where there is less vegetation, the buildings, streets and sidewalks absorb the majority of solar energy input.
Because the city has less water, runoff is greater in the cities because the pavements are largely nonporous (except by the pot holes). Thus, evaporative cooling is less, which contributes to the higher air temperatures.
Waste heat from city buildings, cars and trains is another factor contributing to the warm cities. Heat generated by these objects eventually makes its way into the atmosphere. This heat contribution can be as much as one-third of that received from solar energy.
The thermal properties of buildings add heat to the air by conduction. Tar, asphalt, brick and concrete are better conductors of heat than the vegetation of the rural area.
The canyon structure that tall buildings create enhances the warming. During the day, solar energy is trapped by multiple reflections off the buildings while the infrared heat losses are reduced by absorption.
The urban heat island effects can also be reduced by weather phenomena. The temperature difference between the city and surrounding areas is also a function of the synoptic scale winds. Strong winds reduce the temperature contrast by mixing together the city and rural air.
The urban heat island may also increase cloudiness and precipitation in the city, as a thermal circulation sets up between the city and surrounding region.
Heat islands can occur year-round during the day or night. Urban-rural temperature differences are often largest during calm, clear evenings. This is because rural areas cool off faster at night than cities, which retain much of the heat stored in roads, buildings, and other structures. As a result, the largest urban-rural temperature difference, or maximum heat island effect, is often three to five hours after sunset.
NOTE: See how the high temperatures are more uniform city and rural while nighttime readings are very different with the cities retaining heat.
Enlarged
-------------
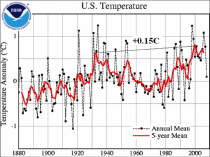
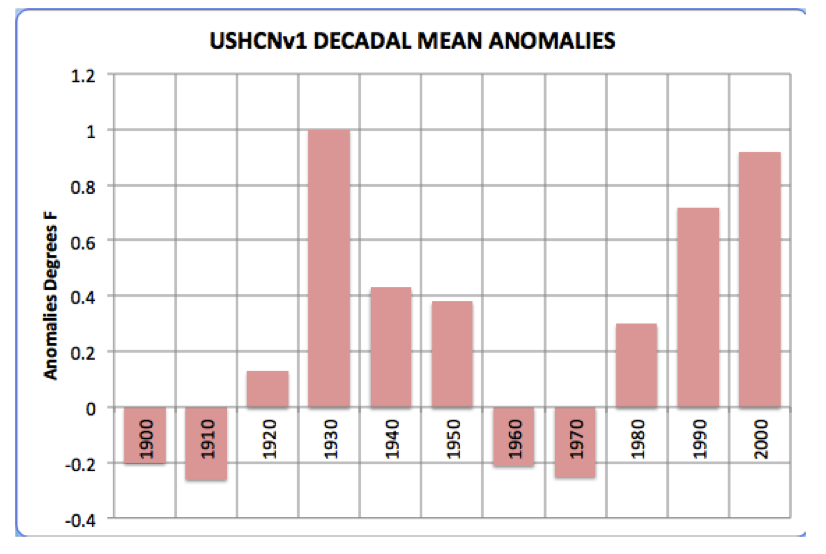
The old USHCN data set up to 2007 had a UHI adjustment. It showed the 1930s dominated.
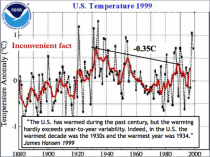
Enlarged
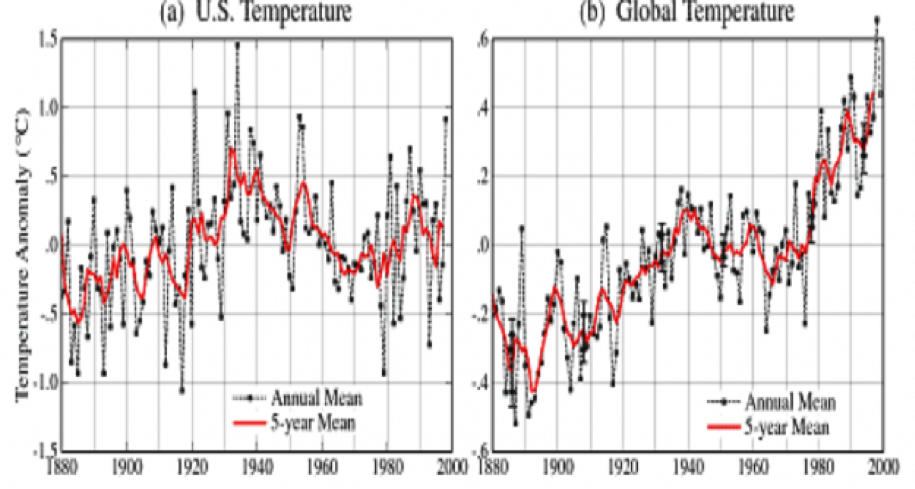
The data was at odds with the global temperature curve which had no UHI adjustment.
Enlarged
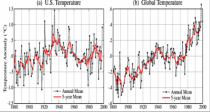
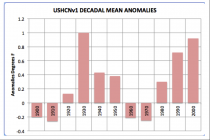
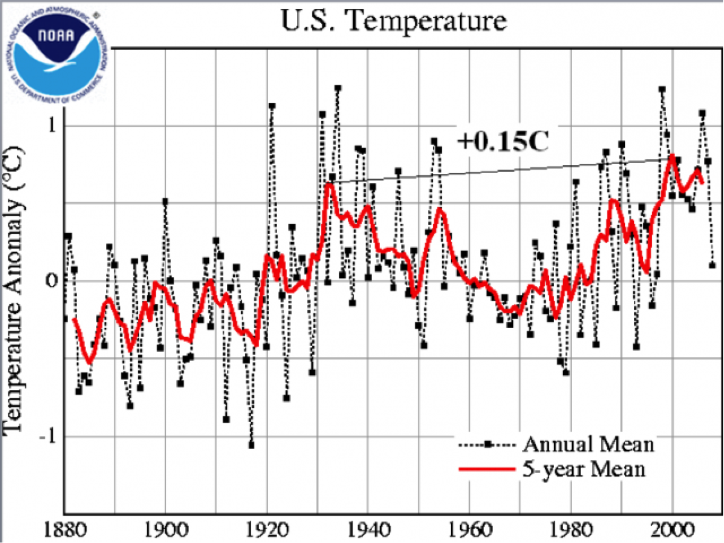
In response, NOAA removed the UHI replacing it with algorithms that are supposed to detect previously undocumented site changes and by homogenization. This is what resulted - much more in line with the global.
Enlarged
Here is the difference between the original and new politically driven version (courtesy Real Science).
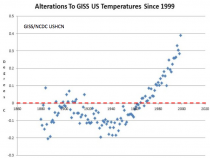
Enlarged
If we had continued with USHCN version 1, the 2000s would be the second warmest decade behind the 1930s.
Enlarged
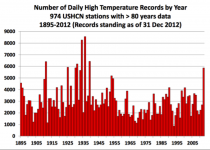
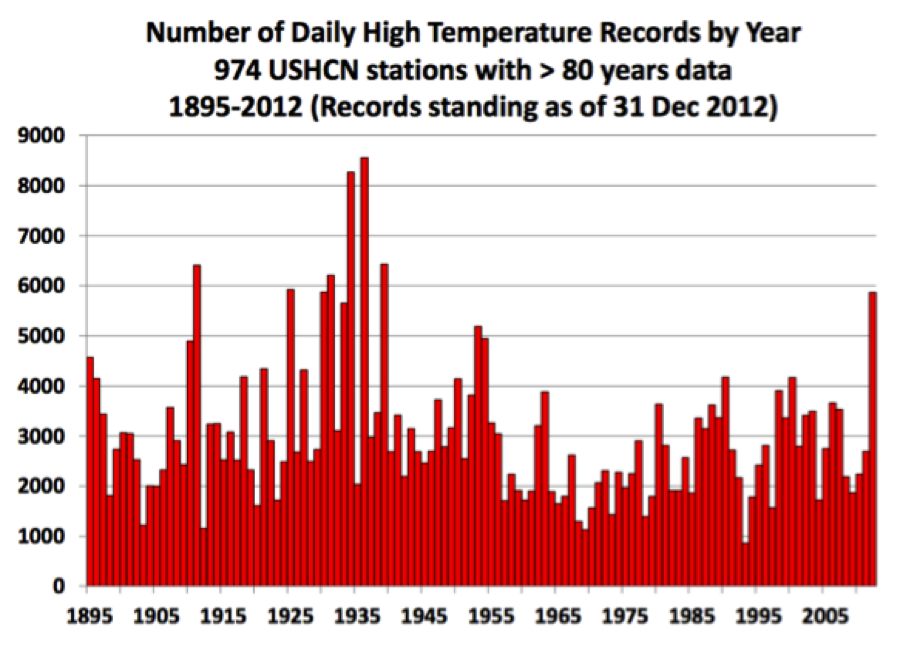
The dominance of the 1930s certainly shows up in the record highs.
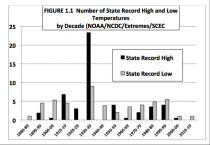
Enlarged
Enlarged
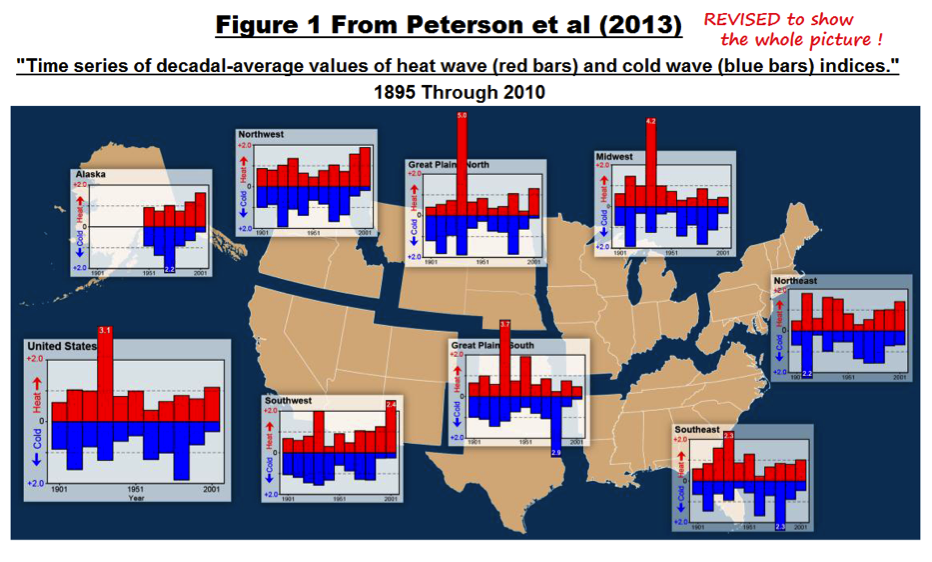
In fact an NCDC paper by Peterson et al of NCDC recently published agreed. The graph is more properly scaled by Dr Richard Keen showing relative magnitude better.
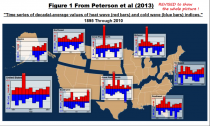
Enlarged
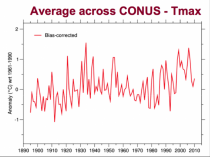
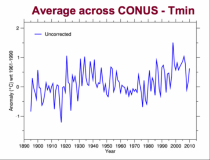
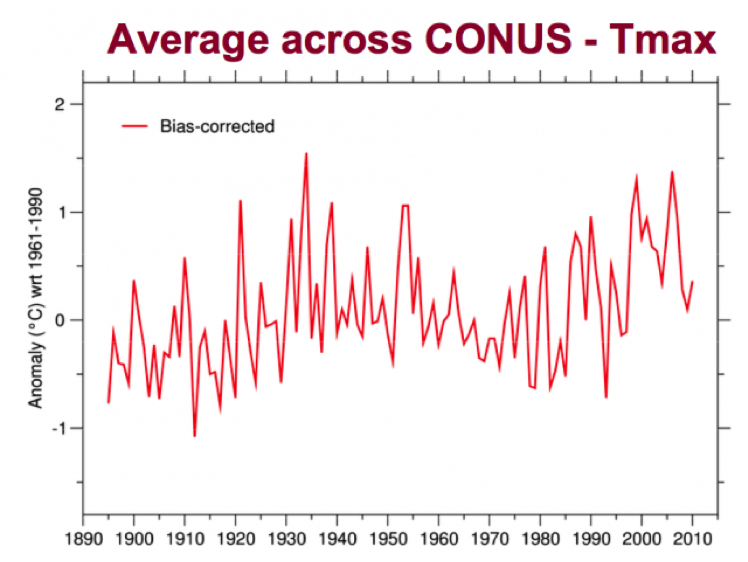
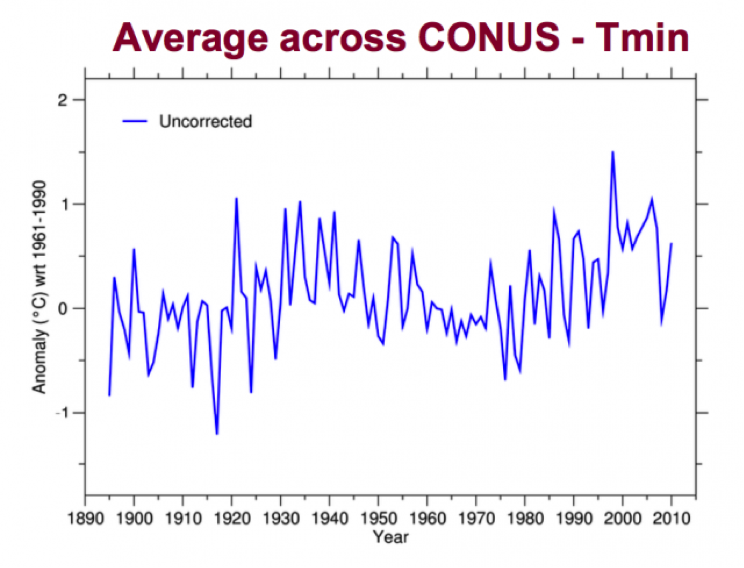
NOAA NCDC presentation showing that as the EPA noted, most of the changes are in the nighttime readings where the cities hold onto the daytime heat. During the day, rural and urban areas come much more in line. The trend in the Tmax according to NOAA is weak with the PDO/AMO/TSI 60-70 year cycle remaining.
Enlarged
Enlarged
The warming is mostly in the T min.
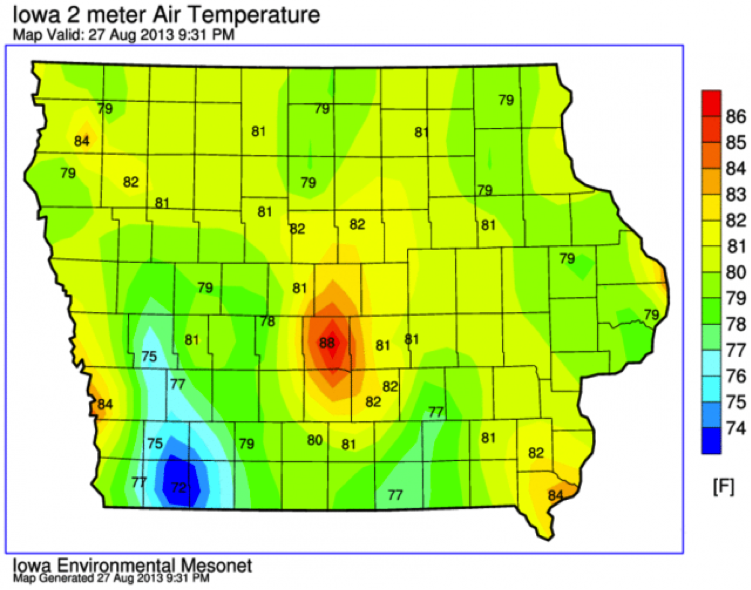
Want an extreme example of UHI - take Des Moines, IA where the official station at the airport in between two runways inside the urban areas and is always warmer than the surroundings even stations within but nearer the edge of the metro area. At 9:31pm Tuesday, August 27, 2013. it was still 88F in DSM although it was as cool as 72F in surrounding stations.

Enlarged
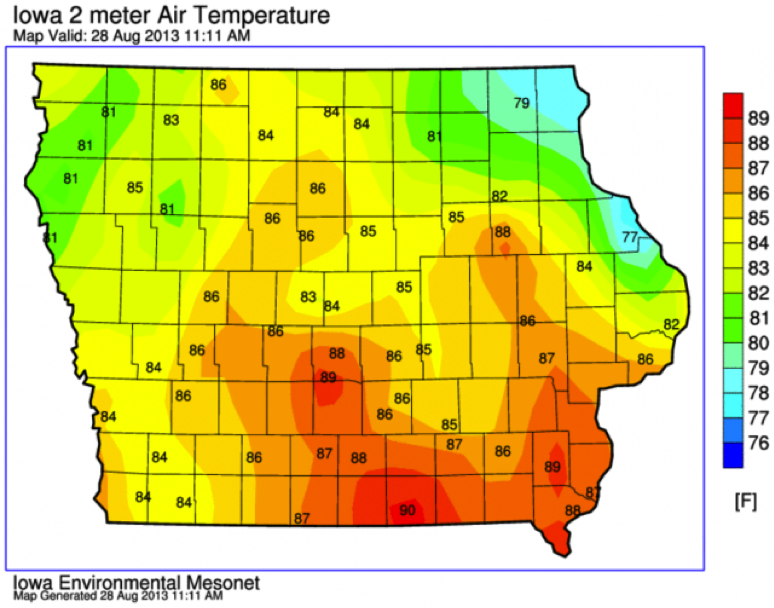
By late morning in the 28th, the differences are much smaller, 1 to 3F.
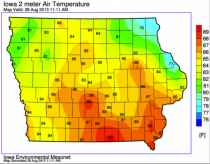
Enlarged
The real climate signal is in the well sited stations in rural areas. Instead of using these stations to adjust down the urban heat contaminated stations like DSM, the process of homogenization spreads the warmth to the good stations. See Dr Ed Long, formerly of NASA’s analysis that demonstrates this hereOn the Tmax issue, Dick McNider has been really advocating using Tmax in lieu of using Tmim or, therefore, Tmean. See most recently
McNider, R.T., G.J. Steeneveld, B. Holtslag, R. Pielke Sr, S. Mackaro, A. Pour Biazar, J.T. Walters, U.S. Nair, and J.R. Christy, 2012: Response and sensitivity of the nocturnal boundary layer over land to added longwave radiative forcing. J. Geophys. Res., 117, D14106, doi:10.1029/2012JD017578. Copyright (2012) American Geophysical Union.
but also
Klotzbach, P.J., R.A. Pielke Sr., R.A. Pielke Jr., J.R. Christy, and R.T. McNider, 2009: An alternative explanation for differential temperature trends at the surface and in the lower troposphere. J. Geophys. Res., 114, D21102, doi:10.1029/2009JD011841
Klotzbach, P.J., R.A. Pielke Sr., R.A. Pielke Jr., J.R. Christy, and R.T. McNider, 2010: Correction to: ”An alternative explanation for differential temperature trends at the surface and in the lower troposphere. J. Geophys. Res., 114, D21102, doi:10.1029/2009JD011841”, J. Geophys. Res., 115, D1, doi:10.1029/2009JD013655.
I believe that UHI and land use change are a major component of the observed warming trend. Multidecadal cycles in the sun and oceans account for most all of the rest.
BTW, go here and see how Central Park NYC shows what a mess the UHI and versioning by NOAA of data has been and then follow it through the GISS window into station data to convince you there is no way jose we could hope to estimate global changes to a precision of 0.1 F. In the words of John von Neumann, father of the computer and of algorithms, “There’s no sense in being precise when you don’t even know what you’re talking about.”
Sep 10, 2013
A Science-Based Rebuttal to Global Warming Alarmism
By Steve Goreham
CHICAGO, September 10, 2013
On September 23, the Intergovernmental Panel on Climate Change (IPCC) is scheduled to release the first portion of its Fifth Assessment Report (AR5). AR5 will conclude once again that mankind is causing dangerous climate change. But one week prior on September 17, the Nongovernmental International Panel on Climate Change (NIPCC) will release its second report, titled Climate Change Reconsidered II (CCR-II). My advance review of CCR-II shows it to be a powerful scientific counter to the theory of man-made global warming.
Today, 193 of 194 national heads of state say they believe humans are causing dangerous climate change. The IPCC of the United Nations has been remarkably successful in convincing the majority of the world that greenhouse gas emissions must be drastically curtailed for humanity to prosper.
The IPCC was established in 1988 by the World Meteorological Organization and the United Nations Environmental Program. Over the last 25 years, the IPCC became the “gold standard” of climate science, quoted by all the governments of the world. IPCC conclusions are the basis for climate policies imposed by national, provincial, state, and local authorities. Cap-and-trade markets, carbon taxes, ethanol and biodiesel fuel mandates, renewable energy mandates, electric car subsidies, the banning of incandescent light bulbs, and many other questionable policies are the result. In 2007, the IPCC and former Vice President Al Gore shared the Nobel Peace Prize for work on climate change.
But a counter position was developing. In 2007, the Global Warming Petition Project published a list of more than 31,000 scientists, including more than 9,000 PhDs, who stated, “There is no convincing scientific evidence that human release of carbon dioxide, methane, or other greenhouse gases is causing or will, in the foreseeable future, cause catastrophic heating of the Earth’s atmosphere and disruption of the Earth’s climate.” At the same time, an effort was underway to provide a credible scientific counter to the alarming assertions of the IPCC.
The Nongovernmental International Panel on Climate Change was begun in 2003 by Dr. Fred Singer, emeritus professor of atmospheric physics from the University of Virginia. Dr. Singer and other scientists were concerned that IPCC reports selected evidence that supported the theory of man-made warming and ignored science that showed that natural factors dominated the climate. They formed the NIPCC to offer an independent second opinion on global warming.
Climate Change Reconsidered I (CCR-I) was published in 2009 as the first scientific rebuttal to the findings of the IPCC. Earlier this summer, CCR-I was translated into Chinese and accepted by the Chinese Academy of Sciences as an alternative point-of-view on climate change.
Climate Change Reconsidered II is a 1,200-page report that references more than one thousand peer-reviewed scientific papers, compiled by about 40 scientists from around the world. While the IPCC reports cover the physical science, impacts, and mitigation efforts, CCR-II is strictly focused on the physical science of climate change. Its seven chapters discuss the global climate models, forcings and feedbacks, solar forcing of the climate, and observations on temperature, the icecaps, the water cycle and oceans, and weather.
Among the key findings of CCR-II are:
Doubling of CO2 from its pre-industrial level would likely cause a warming of only about 1C, hardly cause for alarm.
The global surface temperature increase since about 1860 corresponds to a recovery from the Little Ice Age, modulated by natural ocean and atmosphere cycles, without need for additional forcing by greenhouse gases.
There is nothing unusual about either the magnitude or rate of the late 20th century warming, when compared with previous natural temperature variations.
The global climate models projected an atmospheric warming of more than 0.3C over the last 15 years, but instead, flat or cooling temperatures have occurred.
The science presented by the CCR-II report directly challenges the conclusions of the IPCC. Extensive peer-reviewed evidence is presented that climate change is natural and man-made influences are small. Fifteen years of flat temperatures show that the climate models are in error.
Each year the world spends over $250 billion to try to decarbonize industries and national economies, while other serious needs are underfunded. Suppose we take a step back and “reconsider” our commitment to fighting climate change?
The Nongovernmental International Panel on Climate Change is a project supported by three independent nonprofit organizations: Science and Environmental Policy Project, Center for the Study of Carbon Dioxide and Global Change, and The Heartland Institute. Steve Goreham is Executive Director of the Climate Science Coalition of America and author of the book The Mad, Mad, Mad World of Climatism: Mankind and Climate Change Mania.
Sep 03, 2013
Latest score: Russian Coast Guard 1 Greenpeace 0
Tony Aardvark
Greenpeace have just made a massive miscalculation of who to mess with in the Arctic, in this case Russia.
The story goes like this Greenpeace wanted to go the Northern Sea Route in Russia’s Arctic and protest, for that read, interrupt the search for oil and gas in the Arctic, the Arctic is reckoned to have 13% of the worlds undiscovered oil reserves and around 31% of the worlds undiscovered natural gas reserves.
Entry to the Northern Sea Route is by permit only, Greenpeace applied 3 times, and 3 times the Russians rejected the application, so the nobly motivated watermelons at Greenpeace decided they would ignore the lack of permit and go anyway.
A major miscalculation by Greenpeace, the old USSR might be gone, but the new Russia led by Comrade Putin is little changed from the USSR, now instead of the KGB, there are the incredibly rich oligarchs and Gazprom pulling the strings behind the scenes, with same the ruthlessness that the KGB once did. Democracy and free democratic protest is an anathema to Russians used to centuries of despotic rule by the Czars and 70 years of communist tyranny, and the sort of praise that Greenpeace gets in the west from fawning Liberal politicians is never going to happen in Russia.
A Greenpeace icebreaker that entered Russia’s Arctic without permission to protest offshore energy exploration is leaving after being threatened with gunfire by that country’s coast guard.
“It was repeated several times in open conversation that they were threatening that if we didn’t leave the Northern Sea Route that they would fire on our ship,” Christy Ferguson, a Canadian crew member on the Arctic Sunrise steaming back to Norwegian waters, said Monday
Russia is not about to let anyone or anything interfere with it’s natural gas supplies, the Russian energy giant Gazprom is more than just a massive revenue earner for the country, Gazprom is an extension of Russian foreign policy and will as was demonstrated in a spat with the Ukraine in 2009 when Gazprom turned off the gas supplies to that country.
The inflatables were called back and the crew didn’t prevent four unarmed Russian coast guard officers from boarding. They subjected the Arctic Sunrise to a lengthy inspection which, Ferguson said, found nothing wrong.
“They asked us a lot of questions about why we were here? What’s our reasons? What are our intentions? They were communicating back and forth to their captain and they told us that their captain demanded that we leave the Northern Sea Route area immediately and that if we didn’t, he would use ‘strict measures.’
“We asked, ‘What do you mean by strict measures?’ They confirmed that what they meant by strict measures was fire.
“Preventive fire, at first.”
Post COP18 Russia has been as obstructive as possible to the stupidities of the UNFCCC climate process and any apparent Green posturing by Putin on Shale Gas is nothing to do with being Green, it is quite simply to do with economics and foreign power.
Shale gas is bad news for Gazprom because it is competition and it is cheap, the more shale gas in Europe the smaller Gazproms market is and revenues fall, the secret with anything is always to follow the money.
Greenpeace are now leaving the Northern Sea Route, tail between their legs, shadowed by a Russian Coast Guard ship for the 4 day journey back to international waters.
The opposition to anything that does not match the Green dream is the usual knee jerk reaction that is to be expected from Greenpeace, in the words of one of the co-founders who has since left the NGO, Patrick Moore:
“These people are either completely naive about the relationship between CO2 and plants or they are making this up as a way of deflecting attention from the lack of warming for the past 15 years.”
Just how out of touch with reality Greenpeace are is best illustrated by this statement from one of the Arctic Sunrise crew:
“We came here to expose preparations for oil drilling and what we ended up exposing was that, and something else - the efforts of the Russian authorities to defend oil interests.” No, You exposed Greenpeace to even more ridicule.
There was nothing to expose, the evidence of the importance of fossil fuels to Russia can easily be determined from a few Google searches, most of the world knows that exploration of the Arctic is underway, there have been enough MSM news stories about Champagne Green celebrities like Paul McCartney signing petitions to stop Arctic exploration.
Greenpeace really thought it would be business as usual for them in the Arctic, but there is a lesson to be learned for them here, all countries are not governed by an albeit dwindling band of Green Liberal politicians like those in Europe and currently in Australia, some countries are governed by real politicians that put the needs of their country and their people ahead of pandering to a noisy micro minority with an irrational fear of a trace gas that is essential to all life on earth.
Aug 23, 2013
Stalking the Rogue Hotspot
by Willis Eschenbach
Dr. Kevin Trenberth is a mainstream climate scientist, best known for inadvertently telling the world the truth about the parlous state of climate science itself. In the Climategate emails published in 2009, it was revealed that in private he had said:
The fact is that we can’t account for the lack of warming at the moment and it is a travesty that we can’t.
This from a spokesman for the folks who have been telling us for years that the science is settled…
However, the problem seems to be solved. Kevin Trenberth, Distinguished Senior Scientist, (as he is described on his web page) has emailed Joe Romm, Distinguished Senior Climate Alarmist, about the status of Dr. Trenberth’s tireless quest to find the missing heat, stating (emphasis in Romm’s post):
“We can confidently say that the risk of drought and heat waves has gone up and the odds of a hot spot somewhere on the planet have increased but the hotspot moves around and the location is not very predictable. This year perhaps it is East Asia: China, or earlier Siberia? It has been much wetter and cooler in the US (except for SW), whereas last year the hot spot was the US. Earlier this year it was Australia (Tasmania etc) in January (southern summer). We can name spots for all summers going back quite a few years: Australia in 2009, the Russian heat wave in 2010, Texas in 2011, etc.”
I’ll return to the serious question of Dr. Trenberth’s missing heat in a moment. But first, let’s consider Dr. Trenberth’s statement, starting with the section highlighted in bold in Joe’s post, viz:
“We can confidently say that the risk of drought and heat waves has gone up and the odds of a hot spot somewhere on the planet have increased but the hotspot moves around and the location is not very predictable.”
That single sentence contains all the required elements of a good novel, unpredictability, increasing risks, a dangerous moving “hotspot”, confident experts, a planet in peril...all the stuff that goes into an exciting story, it’s perfect for a direct to DVD movie.
The only problem with Dr. Trenberth’s statement is that like all novels, it’s fiction. To start with, Dr. Trenberth is very careful not to claim that droughts and heat waves and “hotspots” have actually increased. Did you notice that? You need to watch statements about climate very closely. He didn’t say that the number of droughts or heat waves have gone up. That’s a falsifiable statement, and one which is decidedly not true, so he prudently avoided that pitfall. The IPCC itself has said that we have no evidence of any increases in drought, in heat waves, or in any other climate extremes, despite a couple of centuries involving a couple of degrees of warming. But then, Dr. Trenberth didn’t say droughts or heat waves have gone up, did he?
He said the risk of droughts and heat waves has gone up. He said the “odds of a hot spot somewhere on the planet” have gone up. Presumably, this deep knowledge of the probability of future climate catastrophes has been vouchsafed to Dr. Trenberth by means of the climate models… the same climate models that are part of the “travesty” because they can’t account for the missing heat. He’s citing risks and odds based on climate models that were unable to forecast the current hiatus in warming which has gone on for fifteen years or so now, despite continuing increases in CO2 and methane and black carbon and the like…
The part that I particularly enjoyed is the foreboding, menacing quality of his claim that there is now some roving “hotspot”, whose location “moves around” and “is not very predictable”. Dang, what if the dreaded “hotspot” comes to my town? Does he mean we might be faced with the much-feared phenomenon known locally as “a really hot summer”. We know those summers, when bad things happen, like the time when Jimmy Fugate punched out the eleventh guy, by Jimmy’s actual count, who had said “Hot enough for ya?” to him on that fateful August day...but although I digress, we know the danger is real, because as Dr. Trenberth warns us, the hot spot is on the move, viz:
It has been much wetter and cooler in the US (except for SW), whereas last year the hot spot was the US. Earlier this year it was Australia (Tasmania etc) in January (southern summer). We can name [hot]spots for all summers going back quite a few years…
I gotta admit, this is stunning news. Dr. Trenberth is giving us inside climate information, full of extra scientificity, that every summer some places are extra-hot, while you’d be amazed to find out, other locations have extra-cool summers. We’re in one of the latter where I live. Around here, this has been one of the coolest summers in recent years.
So following in Dr. Trenberth’s trail-blazing footsteps, here’s my new climate theory. It revolves around the dreaded “coldspot”. You may be shocked when I tell you that every summer there’s a “coldspot” somewhere in the world, a place where the summer is much colder than usual. Last year the coldspot was Russia. This year it has moved to Northern California where I live. Here’s what makes coldspots so dangerous, as highlighted by Dr. Trenberth. The coldspot “moves around and the location is not very predictable"… so you should be very afraid, because science.
I mean… are we supposed to take this talk of “moving hotspots” seriously? Is this how desperate the alarmists are getting?
Joe Romm’s quote of Dr. Trenberth closes with this suitably ominous line, which I assume is preparing us for the sequel…
Similarly with risk of high rains and floods: They are occurring but the location moves.
Ahhh, Dr. Trenberth is referring to the dreaded “wetspot”, and he doesn’t mean the one the baby leaves on your shoulder. Did you know that every year during the rainy season there’s a “wetspot” somewhere in the world, a place where it rains more than usual? And did you know the wetspot moves around the world and the location is not very predictable? There’s no end to the insights available in Dr. Trenberth’s concepts…
I have to say, I find Dr. Trenberth’s claims both very depressing and very encouraging. They’re depressing because they are a million miles from science. It’s just a frightening tale for children around the campfire, about how the risks of bad things are rising, and it’s worse than we thought.
But it’s encouraging, because when the intellectual leaders of the climate alarmism movement sink to peddling those kinds of scare stories, it’s a clear indication that they’re way short of actual scientific arguments to back up their inchoate fears of Thermageddon.
In any case, let me move on to the more serious topic I mentioned above, regarding Dr. Trenberth’s infamous “missing heat”. Let me suggest where some of it is going. It’s going back out to space.
One of the main thermal controls on the planet’s heat balance is the relationship between surface temperature on one hand, and the time of day of cumulus and cumulonimbus formation in the tropics. On days when the surface is warmer, clouds form earlier in the day. The opposite is true when the surface is cooler, clouds form later. This control operates on an hourly basis. I’ve shown how this affects the daily evolution of tropical temperature here and here using the TAO moored buoy data. Here’s a bit of what I demonstrated in those posts. Figure 2, from the second citation, shows how cold mornings and warm mornings affect the evolution of the temperature of the ensuing day.
The control of the surface temperature is exerted in two main ways: 1) in the morning, cumulus cloud formation reduces incoming solar radiation by reflecting it back to space, and 2) in the afternoon, thunderstorms both increase cloud coverage and remove energy from the surface and transport it to the upper troposphere.
The black line in Figure 2 shows the average day’s cycle. The onset of cumulus is complete by about 10:00. The afternoon is warmer than the morning. As you would expect with an average, the 1 AM temperatures are equal (thin black line).
The days when the dawn is warmer than average for each buoy (red line) show a different pattern. There is less cooling from 1AM to dawn. Cumulus development is stronger when it occurs, driving the temperature down further than on average. In addition, afternoon thunderstorms not only keep the afternoon temperatures down, they also drive evening and night cooling. As a result, when the day is warmer at dawn, the following morning is cooler.
In general, the reverse occurs on the cooler days (blue line). Cooling from 1 AM until dawn is strong. Warming is equally strong. Morning cumulus formation is weak, as is the afternoon thunderstorm foundation. As a result, when the dawn is cooler, temperatures continue to climb during the day, and the following 1AM is warmer than the preceding 1 AM.
Regarding the reduction in incoming solar energy, in a succeeding post called “Cloud Radiation Forcing in the TAO Dataset”, I provided measurements of the difference between the shortwave and longwave radiation effects of tropical clouds, based on the same TAO buoy data. The measurements showed that around noon, when cumulus usually form, the net effect of cloud cover (longwave minus shortwave) was a reduction of half a kilowatt per square metre in net downwelling radiative energy.
In addition to that reduction in downwelling radiation, there is another longer-term effect. This is that we lose not only the direct energy of the solar radiation, but also the subsequent “greenhouse radiation” resulting from the solar radiation. In the TAO buoy dataset, the 24/7 average downwelling solar radiation reaching the surface is about 250 W/m2. Via the poorly-named “greenhouse effect” this results in a 24/7 average downwelling longwave radiation of about 420 w/m2. So for every ten W/m2 of solar we lose through reflection to space, we also lose an additional seventeen W/m2 of the resulting longwave radiation.
This means that if the tropical clouds form one hour earlier or later on average, that reduces or increases net downwelling radiation by about 50 W/m2 on a 24/7 basis. This 100 W/m2 swing in incoming energy, based solely on a plus/minus one-hour variation in tropical cloud onset time, exercises a very strong daily control on the total amount of energy entering the planetary system. This is because most of the sun’s energy enters the climate system in the tropics. As one example, if the tropical clouds form on average at five minutes before eleven AM instead of right at eleven AM, that is a swing of 4 W/m2 on a 24/7 basis, enough to offset the tropical effects of a doubling of CO2…
Not only that, but the control system is virtually invisible, in that there are few long-term minute-by-minute records of daily cloud onset times. Who would notice a change of half an hour in the average time of cumulus formation? It is only the advent of modern nearly constant recording of variables like downwelling long and shortwave radiation that has let me demonstrate the effect of the cloud onset on tropical temperatures using the TAO buoy dataset.
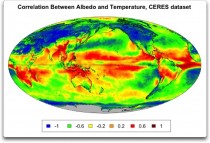
While writing this here on a cold and foggy night, I realized that I had the data to add greatly to my understanding of this question. Remember that I have made a curious claim. This is that in the tropics, as the day gets warmer, the albedo increases. This means that we should find the same thing on a monthly basis - warmer months should result in a greater albedo, there should be a positive correlation between temperature and albedo. This is in contrast to our usual concept of albedo. We usually think of causation going the other way, of increasing albedo causing a decrease in temperature. This is the basis of the feedback from reduced snow and ice. The warmer it gets, the less the snow and ice albedo. This is a negative correlation between albedo and temperature, albedo going down with increasing temperature. So my theory was that unlike at the poles, in the tropics the albedo should be positively correlated with the temperature. However, I’d never thought of a way to actually demonstrate the strength of that relationship at a global level.
So I took a break from writing to look at the correlation of surface temperature and albedo in the CERES satellite dataset. Here’s that result, hot off of the presses this very evening, science at its most raw:
Enlarged
Figure 3. Correlation between albedo and temperature, as shown by the CERES dataset. Underlying data sources and discussion are here.
Gotta confess, I do love results like that. That is a complete confirmation of my claim that in the tropics, as the temperature increases, the albedo increases. Lots of interesting detail there as well ...fascinating.
My conclusion is that Dr. Trenberth’s infamous “missing heat” is missing because it never entered the system. It was reflected away by a slight increase in the average albedo, likely caused by a slight change in the cloud onset time or thickness.
My regards to everyone,
w.
--------
We call these hot spots in summer ‘heat ridges’. They are not new. In fact one will develop in the central US next week.
_thumb.png)
Enlarged
From now on I guess we can alternately call them Trenberths.
|


.png)