11,000-year study’s 20th-century claim is groundless
On March 8, a paper appeared in the prestigious journal Science under the title A reconstruction of regional and global temperature for the past 11,300 years. Temperature reconstructions are nothing new, but papers claiming to be able to go back so far in time are rare, especially ones that promise global and regional coverage.
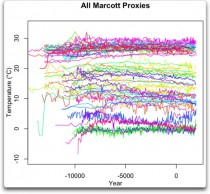
The new study, by Shaun Marcott, Jeremy Shakun, Peter Clark and Alan Mix, was based on an analysis of 73 long-term proxies, and offered a few interesting results: one familiar (and unremarkable), one odd but probably unimportant, and one new and stunning. The latter was an apparent discovery that 20th-century warming was a wild departure from anything seen in over 11,000 years. News of this finding flew around the world and the authors suddenly became the latest in a long line of celebrity climate scientists.
The trouble is, as they quietly admitted over the weekend, their new and stunning claim is groundless. The real story is only just emerging, and it isn’t pretty.
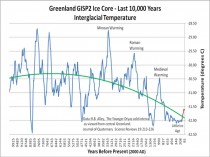
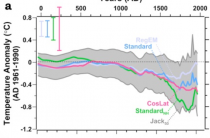
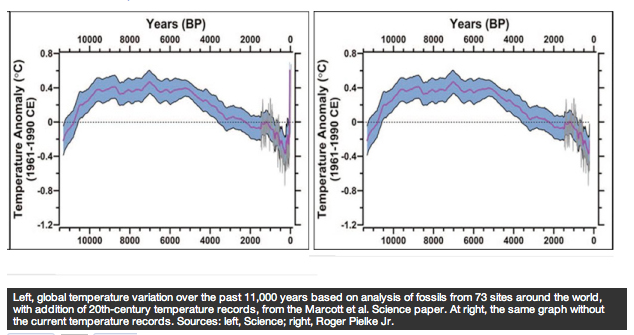
The unremarkable finding of the Marcott et al. paper was that the Earth’s climate history since the end of the last ice age looks roughly like an upside down-U shape, starting cold, warming up for a few thousand years, staying warm through the mid-Holocene (6,000 to 9,000 years ago), then cooling steadily over the past five millennia to the present. This pattern has previously been found in studies using ground boreholes, ice cores and other very long-term records, and was shown in the first IPCC report back in 1990. Some studies suggest it was, on average, half a degree warmer than the present, while others have put it at one or even two degrees warmer. A lot of assumptions have to be made to calibrate long-term proxy measures to degrees Celsius, so it is not surprising that the scale of the temperature axis is uncertain.
Another familiar feature of long-term reconstructions is that the downward-sloping portion has a few large deviations on it. Many show a long, intense warm interval during Roman times 2,000 years ago, and another warm interval during the medieval era, a thousand years ago. They also show a cold episode called the Little Ice Age ending in the early 1800s, followed by the modern warming. But the Marcott et al. graph didn’t have these wiggles, instead it showed only a modest mid-Holocene warming and a smooth decline to the late 1800s. This was odd, but probably unimportant, since they also acknowledged using so-called “low frequency” proxies that do not pick up fluctuations on time scales shorter than 300 years. The differences between the scale of their graph and that of others could probably be chalked up to different methods.
The new, and startling, feature of the Marcott graph was at the very end: Their data showed a remarkable uptick that implied that, during the 20th century, our climate swung from nearly the coldest conditions over the past 11,500 years to nearly the warmest. Specifically, their analysis showed that in under 100 years we’ve had more warming than previously took thousands of years to occur, in the process undoing 5,000 years’ worth of cooling.
This uptick became the focus of considerable excitement, as well as scrutiny. One of the first questions was how it was derived. Marcott had finished his PhD thesis at Oregon State University in 2011 and his dissertation is online. The Science paper is derived from the fourth chapter, which uses the same 73 proxy records and seemingly identical methods. But there is no uptick in that chart, nor does the abstract to his thesis mention such a finding.
Stephen McIntyre of climateaudit.org began examining the details of the Marcott et al. work, and by March 16 he had made a remarkable discovery. The 73 proxies were all collected by previous researchers, of which 31 are derived from alkenones, an organic compound produced by phytoplankton that settles in layers on ocean floors, and has chemical properties that correlate to temperature. When a core is drilled out, the layers need to be dated. If done accurately, the researcher could then interpret the alkenone layer at, say, 50 cm below the surface, to imply (for example) the ocean temperature averaged 0.1 degrees above normal over several centuries about 1,200 years ago. The tops of cores represent the data closest in time to the present, but this layer is often disturbed by the drilling process. So the original researchers take care to date the core-top to where the information begins to become useful.
According to the scientists who originally published the alkenone series, the core tops varied in age from nearly the present to over a thousand years ago. Fewer than 10 of the original proxies had values for the 20th century. Had Marcott et al. used the end dates as calculated by the specialists who compiled the original data, there would have been no 20th-century uptick in their graph, as indeed was the case in Marcott’s PhD thesis. But Marcott et al. redated a number of core tops, changing the mix of proxies that contribute to the closing value, and this created the uptick at the end of their graph. Far from being a feature of the proxy data, it was an artifact of arbitrarily redating the underlying cores.
Worse, the article did not disclose this step. In their online supplementary information the authors said they had assumed the core tops were dated to the present “unless otherwise noted in the original publication.” In other words, they claimed to be relying on the original dating, even while they had redated the cores in a way that strongly influenced their results.
Meanwhile, in a private email to McIntyre, Marcott made a surprising statement. In the paper, they had reported doing an alternate analysis of their proxy data that yielded a much smaller 20th century uptick, but they said the difference was “probably not robust,” which implied that the uptick was insensitive to changes in methodology, and was therefore reliable. But in his email to McIntyre, Marcott said the reconstruction itself is not robust in the 20th century: a very different thing. When this became public, the Marcott team promised to clear matters up with an online FAQ.
It finally appeared over the weekend, and contains a remarkable admission: “[The] 20th-century portion of our paleotemperature stack is not statistically robust, cannot be considered representative of global temperature changes, and therefore is not the basis of any of our conclusions.”
Now you tell us! The 20th-century uptick was the focus of worldwide media attention, during which the authors made very strong claims about the implications of their findings regarding 20th-century warming. Yet at no point did they mention the fact that the 20th century portion of their proxy reconstruction is garbage.
The authors now defend their original claims by saying that if you graft a 20th-century thermometer record onto the end of their proxy chart, it exhibits an upward trend much larger in scale than that observed in any 100-year interval in their graph, supporting their original claims. But you can’t just graft two completely different temperature series together and draw a conclusion from the fact that they look different.
The modern record is sampled continuously and as a result is able to register short-term trends and variability. The proxy model, by the authors’ own admission, is heavily smoothed and does not pick up fluctuations below a time scale of several centuries. So the relative smoothness in earlier portions of their graph is not proof that variability never occurred before. If it had, their method would likely not have spotted it.
What made their original conclusion about the exceptional nature of 20th-century warming plausible was precisely the fact that it appeared to be picked up both by modern thermometers and by their proxy data. But that was an illusion. It was introduced into their proxy reconstruction as an artifact of arbitrarily redating the end points of a few proxy records.
In recent years there have been a number of cases in which high-profile papers from climate scientists turned out, on close inspection, to rely on unseemly tricks, fudges and/or misleading analyses. After they get uncovered in the blogosphere, the academic community rushes to circle the wagons and denounce any criticism as “denialism.” There’s denialism going on all right - on the part of scientists who don’t see that their continuing defence of these kinds of practices exacts a toll on the public credibility of their field.
Financial Post
Ross McKitrick is professor of economics and CME fellow in sustainable commerce at the Department of Economics, University of Guelph.
Note: The original Marcotte findings were in line with the ice core data from Greenland (Richard Alley - no skeptic)
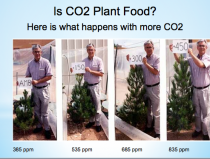
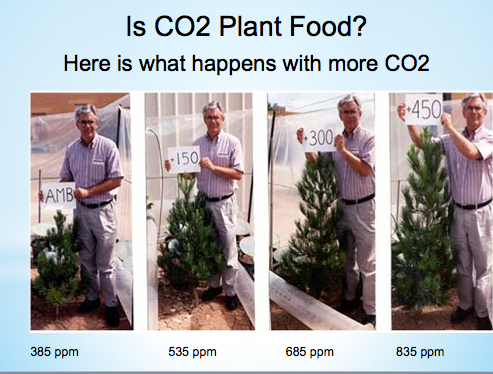
Mar. 25, 2013 - Plenty has been written about concerns over elevated levels of carbon dioxide in Earth’s atmosphere, but a Kansas State University researcher has found an upside to the higher CO2 levels. And it’s been particularly relevant in light of drought that overspread the area in recent months.
“Our experiments have shown that the elevated carbon dioxide that we now have is mitigating the effect that drought has on winter wheat and sorghum and allowing more efficient use of water,” said K-State agronomy professor Mary Beth Kirkham.
Kirkham, who has written a book on the subject, “Elevated Carbon Dioxide: Impacts on Soil and Plant Water Relations,” used data going back to 1958. That’s when the first accurate measurements of atmospheric carbon dioxide were made, she said.
“Between 1958 and 2011 (the last year for which scientists have complete data), the carbon dioxide concentration has increased from 316 parts per million to 390 ppm,” she said. “Our experiments showed that higher carbon dioxide compensated for reductions in growth of winter wheat due to drought. Wheat that grew under elevated carbon dioxide (2.4 times ambient) and drought yielded as well as wheat that grew under the ambient level carbon dioxide and well-watered conditions.”
The research showed that sorghum and winter wheat used water more efficiently as a result of the increased levels of carbon dioxide in the atmosphere, Kirkham said. Because elevated carbon dioxide closes stomata (pores on the leaves through which water escapes), less water is used when carbon dioxide levels are elevated. Evapotranspiration is decreased.
Studies done subsequent to the early work confirmed the findings.
Over the past few months, the researcher said she’s heard people comparing the dry summer of 2012 with the Dust Bowl years of the 1930s and the drought of the mid-1950s in Kansas.
The first accurate measurements of CO2 levels were made in 1958, so while scientists do not know what the concentration of CO2 was in the 1930s, Kirkham said, she used the data that she and her students collected to calculate how much the water use efficiency of sorghum has increased since 1958, which was about the time of the middle of 1950s drought.
“Due to the increased carbon dioxide concentration in the atmosphere, it now takes 55 milliliters (mL) less water to produce a gram of sorghum grain than it did in 1958,” she said. “Fifty-five mL is equal to about one-fourth of a cup of water. This may not seem like a lot of water savings, but spread over the large acreage of sorghum grown in Kansas, the more efficient use of water now compared to 1958 should have a large impact.
“The elevated carbon dioxide in the atmosphere in 2012 ameliorated the drought compared to the drought that occurred in the mid-1950s.”
At the basis of Kirkham’s book are experiments that she and other researchers conducted in the Evapotranspiration Laboratory at K-State from 1984-1991.
“They were the first experiments done in the field in a semi-arid region with elevated carbon dioxide,” Kirkham said. The lab no longer exists, but the work continues.
----------
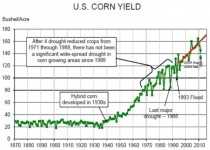
ICECAP NOTE: This is confirmed by looking at corn yields in 2012, down sharply from 2010 but notice well above the drought levels of 1988 and the 1950s when drought was similar. Part o the difference in hybrids and better farming practices, but CO2 experiments have confirmed the K-State study’s findings.
NOTE: CO2Science and the Idsos have shown this to be the case in papers and experiments on their excellent website O2Science.org. The family of PhD scientists have done excellent work on ll aspects of the science and Craig Idso is prime editor of the NIPCC Report, a compilation of reviews of many hundreds of peer review papers with findings that challenge the so called ‘settled science’.
Times have changed since the Wall Street Journal held its first “ECO:nomics-Creating Environmental Capital” conference at the super-swanky Bacara Resort in Santa Barbara. I was there in 2008 (but, alas, stayed at the Best Western in downtown Santa Barbara) when several hundred investors and corporate CEOs listened to leading crony capitalists, including Jeff Immelt of GE, James Rogers of Duke Energy, Andrew Liveris of Dow Chemical, and John Doerr of Kleiner, Perkins, Caulfield and Byers (where Al Gore was also a partner), smugly explain how they were going to strike it rich off the backs of consumers and taxpayers with green energy subsidies and mandates, federal loan guarantees, and the higher energy prices that would make renewable energy competitive with coal, oil, and natural gas once cap-and-trade was enacted.
This year’s sixth annual conference, which I didn’t attend, was also held at the Bacara Resort, but the mood was apparently different. Yesterday, the Journal ran a six-page supplement that summarized the conference’s highlights. The lead article by John Bussey was headlined: “Green Investing: So Much Promise, So Little Return: At The Wall Street Journal’s ECO:nomics conference, the talk was about all the innovations taking place in renewable energy-and about all the investors who are losing interest.”
Bussey writes: “Given all the interest in protecting the environment from mankind’s rapid advance, you’d think this might be the best time ever to invest in renewable energy and the Next Big Green Thing. Guess again. Large parts of green-tech investment look like the torched and salted fields left behind by Roman conquerors: barren, lifeless - and bereft of a return on capital. Put another way: In some areas, if you aren’t already investor road kill, you’re likely the hedgehog in the headlights about to join your maker.”
On page two, an article on a talk by John Dears, chief investment officer of the California Public Employees’ Retirement System (or Calpers), reveals that their “fund devoted to clean energy and technology which started in 2007 with $460 million has an annualized return of minus 9.7% to date.” Dears is quoted as telling the conference: “We have almost $900 million in investment expressly aimed at clean tech. We’re all familiar with the J-curve in private equity. Well, for Calpers, clean-tech investing has got an L-curve for “lose.” Our experience is that this has been a noble way to lose money.”
Yes, con artists gaming the system to raise energy prices, impoverish consumers, destroy jobs, and fleece taxpayers can still take comfort that theirs is “a noble way to lose money.” May it long remain so. The entire 2013 ECO:nomics program may be found here. Read it and gloat now - it may be the last one.
----------
Meanwhile, John Coleman talks about an amazing potential for graphene, basically a form of the demonized element carbon
How the paper passed peer (pal) review is beyond comprehension. It is worse than the original hockey stick paper MBH shown to be a total work of fiction. But timed for the new IPCC, this paper from OSU (Oregon State - amazing how far they have fallen) and Harvard, - from where Holdren and many of our most useless politicians have come forth is one that even has Andy Revkin scratching his head. Of course Mann is changing his undergarments multiple times a day claiming he has been vindicated and alarmists are touting it as a landmark paper. The paper shows how far peer review and Science magazine has degraded.
I should have expected this after OSU professors came to Dc to testify to congress and told them…
The Oregonian printed word for word on the front page.
As one former OSU scientist (not George Taylor) observed:
Steve McIntyre is really outdoing himself with an in-depth analysis of the resurgent ‘Hockey Stick’ from the Marcott-Shakun team at Oregon State University. OSU is redefining what it means to “manipulate data.” I suspect that they could market their techniques to other government agencies like the California Air Resources Board, which has long sought to find convenient correlations where there are none.
The normally serious McIntyre could not suppress his sense of humor with Marcott et al:
“The moral of today’s post for ocean cores. Are you an ocean core that is tired of your current date? Does your current date make you feel too old? Or does it make you feel too young? Try the Marcott-Shakun dating service. Ashley Madison for ocean cores. Confidentiality is guaranteed”
Will Marcott become famous or infamous over this paper? With Shakun apparently behind the hyping of the 20th century upturn (the Hockey Stick) to the press, Marcott denying the significance ("robutness"), and McIntyre pointing out just how ludicrous their analysis was, this is certainly another ‘black-eye’ for science, for Oregon State University, for peer-review, for the journal ‘Science,’ and for the very young authors.
With the admission that Professor Peter Clark apparently “co-wrote” the relevant chapter of Marcott’s doctoral thesis, we have a particularly bizarre situation. Thesis advisers are supposed to guide student efforts but especially at the doctoral level, the finished product needs to come from the student alone. Was Marcott unable to do an adequate job on his own or was Clark too anxious that the paper adhere to the conclusions he wanted to see? I suspect the latter.
Oregon State is fanatical about adherence to the global warming dogma. With the firing of chemist Nick Drapella for questioning the dogma and with the refusal of all his colleagues still employed at OSU to write letters of recommendation, we see an institution governed by fanaticism and fear. They are even more monochromatic than German Universities during the Second World War where a few great physicists like Max Planck, Werner Heisenberg, and Arnold Sommerfeld refused to go along with ‘Deutsche Physik.’
At Climate Audit, Something odd has been discovered about the provenance of the work associate with the Marcott et al paper. It seems that the sharp uptick wasn’t in the thesis paper Marcott defended for his PhD, but is in the paper submitted to Science.
Steve McIntyre writes:
Reader drew our attention to Marcott’s thesis (see chapter 4 here. Marcott’s thesis has a series of diagrams in an identical style as the Science article. The proxy datasets are identical.
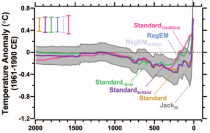
However, as Jean S alertly observed, the diagrams in the thesis lack the closing uptick of the Science. Other aspects of the modern period also differ dramatically.
The differences will be evident to readers. In addition to the difference in closing uptick, important reconstruction versions were at negative values in the closing portion of the thesis graphic, while they were at positive values in the closing portion of the Science graphic.
Its all about how you go from this to a final curve ending with a spike at the end up around 1940:
to this:
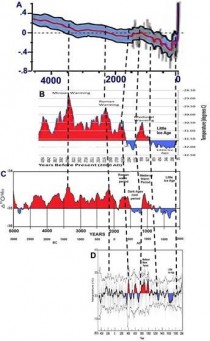
Given Greenland ice cores (shown to correlate well with global mean anomalies) that show this.
Which aligns with the new Hockey Stick as shown below:
Here is the paper:
A Reconstruction of Regional and Global Temperature for the Past 11,300 Years
Shaun A. Marcott1, Jeremy D. Shakun2, Peter U. Clark1, Alan C. Mix1
+ Author Affiliations
1College of Earth, Ocean, and Atmospheric Sciences, Oregon State University, Corvallis, OR 97331, USA.
2Department of Earth and Planetary Sciences, Harvard University, Cambridge, MA 02138, USA.
*To whom correspondence should be addressed. E-mail: marcotts@science.oregonstate.edu
EDITOR’S SUMMARY
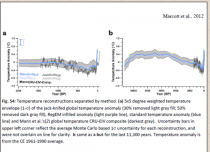
Surface temperature reconstructions of the past 1500 years suggest that recent warming is unprecedented in that time. Here we provide a broader perspective by reconstructing regional and global temperature anomalies for the past 11,300 years from 73 globally distributed records. Early Holocene (10,000 to 5000 years ago) warmth is followed by ~0.7C cooling through the middle to late Holocene (<5000 years ago), culminating in the coolest temperatures of the Holocene during the Little Ice Age, about 200 years ago. This cooling is largely associated with ~2C change in the North Atlantic. Current global temperatures of the past decade have not yet exceeded peak interglacial values but are warmer than during ~75% of the Holocene temperature history.
Intergovernmental Panel on Climate Change model projections for 2100 exceed the full distribution of Holocene temperature under all plausible greenhouse gas emission scenarios.
Note Shakun was the one that tried to manipulate ice core data to show that CO2 preceded or accompanied temperature rises instead of lagging by 800 years or more as all other studies has shown. When prophecies fail when data doesn't match projections, the data is assumed wrong not the theory and try and fix it. They did it with the hot spot (balloon and satellite) with the surface data, with extremes, etc.
See posts exposing the paper (with enlarged views of the images above):
As in Part I, this segment analyzes the Marcott et al. conclusions using the scientific method of Feynman in which conclusions are checked against well-established data from other sources. As Feynman points out, if a hypothesis (conclusion) disagrees with observations and data, it is wrong. It doesn’t make any difference how beautiful the hypothesis (conclusion) is, how smart the author is, or what the author’s name is, if it disagrees with data or observations, it is wrong.
Marcott et al 2013 has received lots of publicity, mainly because of its supposed vindication of the Stick. A number of commenters have observed that they are unable to figure out how Marcott got the Stick portion of his graph from his data set. Add me to that group.
The uptick occurs in the final plot-point of his graphic (1940) and is a singleton. I wrote to Marcott asking him for further details of how he actually obtained the uptick, noting that the enormous 1920-to-1940 uptick is not characteristic of the underlying data. Marcott’s response was unhelpful: instead of explaining how he got the result, Marcott stated that they had “clearly” stated that the 1890-on portion of their reconstruction was “not robust”. I agree that the 20th century portion of their reconstruction is “not robust”, but do not feel that merely describing the recent portion as “not robust” does full justice to the issues. Nor does it provide an explanation.
Of course, no one has made note of the fact the series ends before the post war boom and before CO2 increases allegedly began, so how it vindicates Mann and his team who appended the surface data to his carefully selected tree data and ignored the fact the tree data showed a decline post 1960.
This flailing away with more and more bad science is what Leon Festinger predicted when prophecies fail and a lot is at stake ($100B sank so far) into creating this hoax designed to achieve leftist social and societal and energy changes.
Electric cars are promoted as the chic harbinger of an environmentally benign future. Ads assure us of “zero emissions,” and President Obama has promised a million on the road by 2015. With sales for 2012 coming in at about 50,000, that million car figure is a pipe dream. Consumers remain wary of the cars’ limited range, higher price and the logistics of battery-charging. But for those who do own an electric car, at least there is the consolation that it’s truly green, right? Not really.
For proponents such as the actor and activist Leonardo DiCaprio, the main argument is that their electric cars - whether it’s a $100,000 Fisker Karma (Mr. DiCaprio’s ride) or a $28,000 Nissan Leaf - don’t contribute to global warming. And, sure, electric cars don’t emit carbon-dioxide on the road. But the energy used for their manufacture and continual battery charges certainly does - far more than most people realize.
A 2012 comprehensive life-cycle analysis in Journal of Industrial Ecology shows that almost half the lifetime carbon-dioxide emissions from an electric car come from the energy used to produce the car, especially the battery. The mining of lithium, for instance, is a less than green activity. By contrast, the manufacture of a gas-powered car accounts for 17% of its lifetime carbon-dioxide emissions. When an electric car rolls off the production line, it has already been responsible for 30,000 pounds of carbon-dioxide emission. The amount for making a conventional car: 14,000 pounds
While electric-car owners may cruise around feeling virtuous, they still recharge using electricity overwhelmingly produced with fossil fuels. Thus, the life-cycle analysis shows that for every mile driven, the average electric car indirectly emits about six ounces of carbon-dioxide. This is still a lot better than a similar-size conventional car, which emits about 12 ounces per mile. But remember, the production of the electric car has already resulted in sizeable emissions - the equivalent of 80,000 miles of travel in the vehicle.
So unless the electric car is driven a lot, it will never get ahead environmentally. And that turns out to be a challenge. Consider the Nissan Leaf. It has only a 73-mile range per charge. Drivers attempting long road trips, as in one BBC test drive, have reported that recharging takes so long that the average speed is close to six miles per hour - a bit faster than your average jogger
Charlie Drevna, president of the American Fuel & Petrochemical Manufacturers, on how Washington’s fuel standards are increasing the price of cars and gas.
To make matters worse, the batteries in electric cars fade with time, just as they do in a cellphone. Nissan estimates that after five years, the less effective batteries in a typical Leaf bring the range down to 55 miles. As the MIT Technology Review cautioned last year: “Don’t Drive Your Nissan Leaf Too Much.”
If a typical electric car is driven 50,000 miles over its lifetime, the huge initial emissions from its manufacture means the car will actually have put more carbon-dioxide in the atmosphere than a similar-size gasoline-powered car driven the same number of miles. Similarly, if the energy used to recharge the electric car comes mostly from coal-fired power plants, it will be responsible for the emission of almost 15 ounces of carbon-dioxide for every one of the 50,000 miles it is driven - three ounces more than a similar gas-powered car.
Even if the electric car is driven for 90,000 miles and the owner stays away from coal-powered electricity, the car will cause just 24% less carbon-dioxide emission than its gas-powered cousin. This is a far cry from “zero emissions.” Over its entire lifetime, the electric car will be responsible for 8.7 tons of carbon dioxide less than the average conventional car.
Those 8.7 tons may sound like a considerable amount, but it’s not. The current best estimate of the global warming damage of an extra ton of carbon-dioxide is about $5. This means an optimistic assessment of the avoided carbon-dioxide associated with an electric car will allow the owner to spare the world about $44 in climate damage. On the European emissions market, credit for 8.7 tons of carbon-dioxide costs $48.
Yet the U.S. federal government essentially subsidizes electric-car buyers with up to $7,500. In addition, more than $5.5 billion in federal grants and loans go directly to battery and electric-car manufacturers like California-based Fisker Automotive and Tesla Motors TSLA +1.61% . This is a very poor deal for taxpayers.
The electric car might be great in a couple of decades but as a way to tackle global warming now it does virtually nothing. The real challenge is to get green energy that is cheaper than fossil fuels. That requires heavy investment in green research and development. Spending instead on subsidizing electric cars is putting the cart before the horse, and an inconvenient and expensive cart at that.
Mr. Lomborg, director of the Copenhagen Consensus Center in Washington, D.C., is the author of “The Skeptical Environmentalist” (Cambridge Press, 2001) and “Cool It” (Knopf, 2007).
A version of this article appeared March 11, 2013, on page A15 in the U.S. edition of The Wall Street Journal, with the headline: Green Cars Have a Dirty Little Secret.
---------------
Matt Ridley talks about Fossil Fuels are Greening the Planet


