

By Anthony Watts, Watts Up With That
Those that have been watching the IARC-JAXA Arctic sea ice plot, and noting the slope of gain, rather expected this to happen. Today it did.
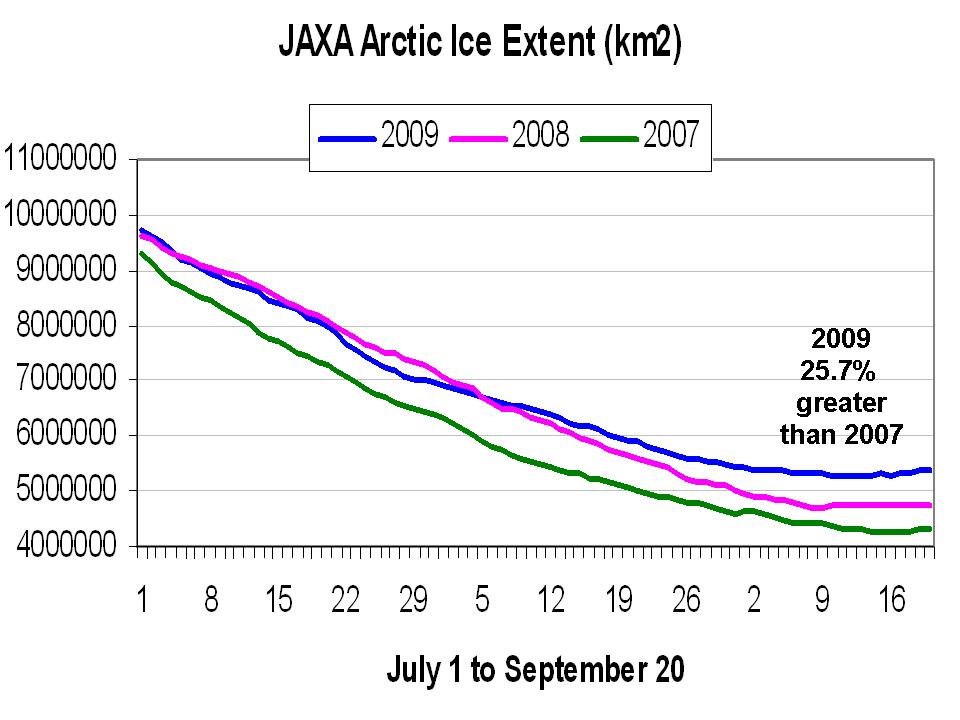
Here’s the current IARC-JAXA Sea Ice Extent plot:
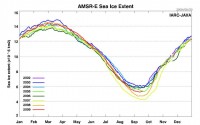
See larger image here.
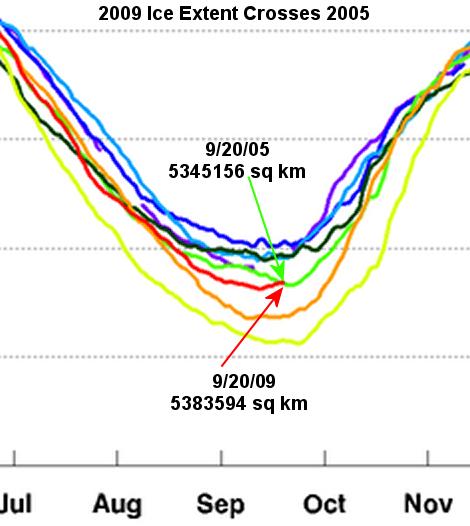
And here is the plot magnified and annotated to show the crossing:
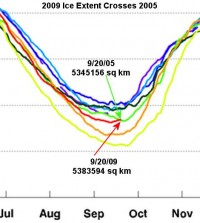
See larger image here.
While 2009 minimum on 09/13 of 5,249,844 was just 65,312 sq km below 2005 in minimum extent, which occurred on 9/22/2005 with 5,315,156 sq km, it has now rebounded quickly and is higher by 38,438 sq km, just 2 days before the 9/22/05 minimum. On 9/22/2009 it may very well be close to 60-80,000 sq km higher than the minimum on the same date in 2005.
While by itself this event isn’t all that significant, it does illustrate the continued rebound for the second year. The fact that we only missed the 2005 minimum by 65,312, which is about one days worth of melt during many days of the melt season is also noteworthy. See more and comments here.
Icecap Note:
We also as of the 20th were running 25.7% greater than 2007.
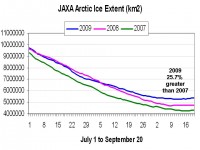
See larger image here.

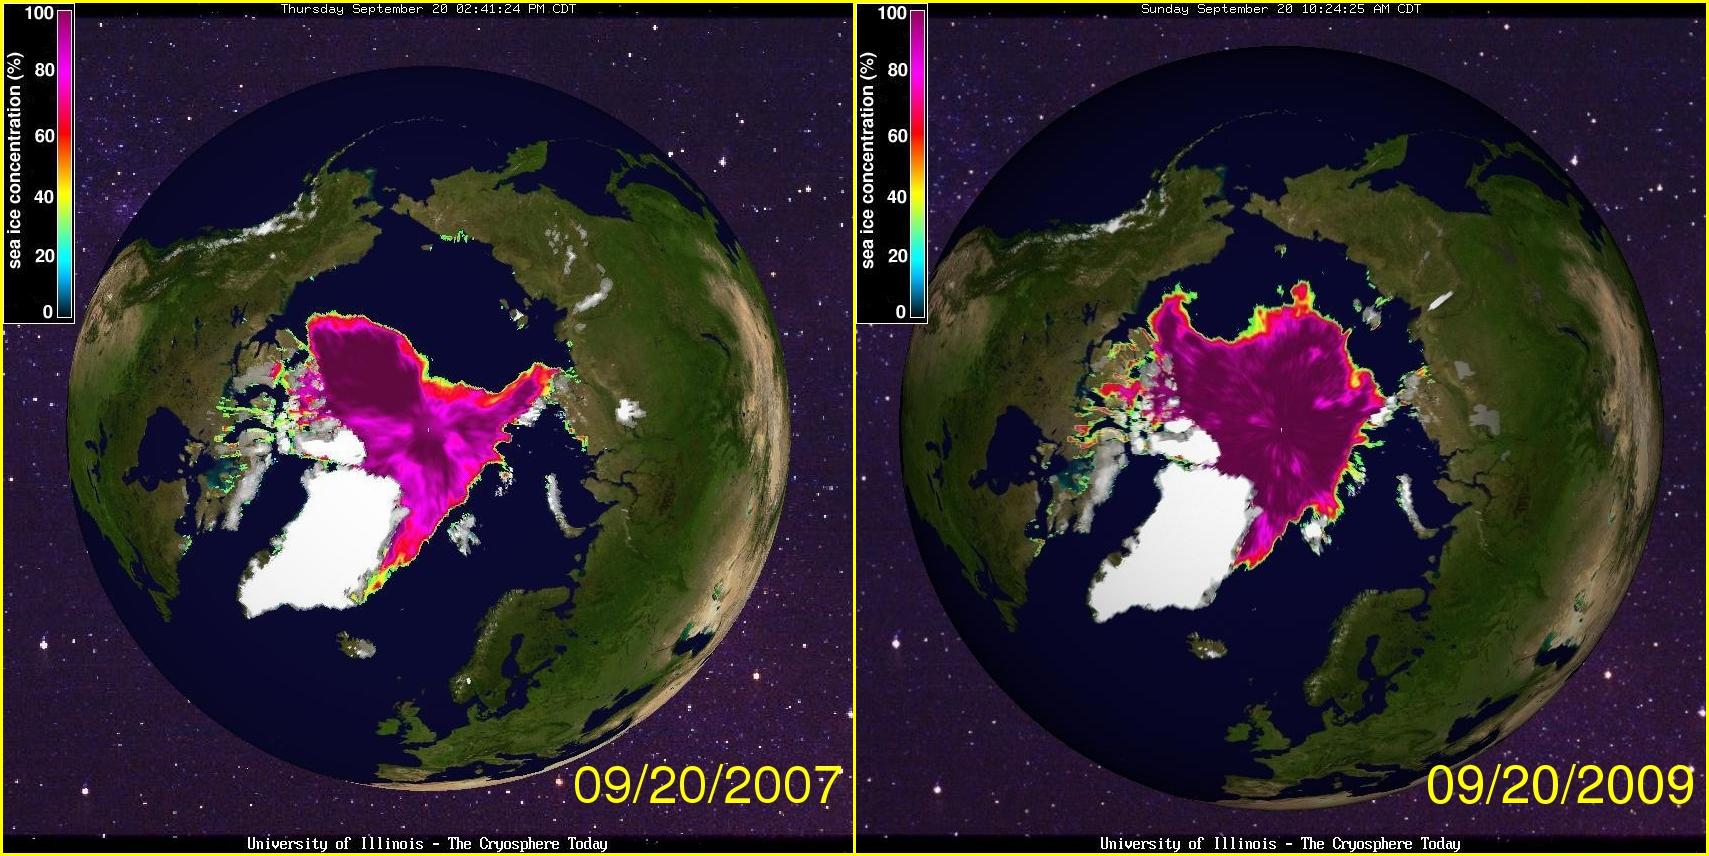
Compare 2007 with 2009 image here.