Nov 01, 2008
Anti-Energy Collaborative Effort in Colorado
Paul Chesser, Climate Strategies Watch
Over at my Web site I’ve posted a long, blow-by-blow account of how Colorado Gov. Bill Ritter and his administration repeatedly enlisted the William and Flora Hewlett Foundation to pay for his global warming alarmist agenda (a “new energy economy") and for his efforts to keep the federal Bureau of Land Management from leasing for oil and gas exploration on the Roan Plateau. It’s sometimes a dry recitation but there are a ton of documents linked that I obtained from the governor’s office and from CDNR.
The quick-’n-dirty summary: Almost immediately after he took office Ritter had a “Climate Action Plan” he wanted to pursue, which included two new positions in his administration: a cabinet-level climate policy adviser to create “a bold and visionary climate action policy,” and a liaison to the Public Utilities Commission to “develop a climate-wise utility policy.” He asked for, and got, two annual grants from Hewlett for $200,000 ($400,000 total) to fund the positions. Ritter worked through Hewlett’s environmental program director Hal Harvey—a far-left, Obama-supporting (and -contributing) environmental extremist who founded the Energy Foundation and is president of the crackpot enviro/population control-advocating New-Land Foundation—to pay for his climate people. I guess the state budget process would not come up with the money fast enough for Ritter.
Within a few months Ritter had another environmental cause to fight: obstructing and delaying the Bureau of Land Management from leasing the rights to oil and natural gas exploration on the rich Roan Plateau. It had been ten years already since BLM was given the mandate to lease the Naval Oil and Shale Reserves, and it was finally ready to start doing so after years of environmental study and review. But that still wasn’t long enough for Ritter, his eco-cronies, Reps. Mark Udall and John Salazar, and Sen. Ken Salazar (pictured). All got involved in trying to further delay BLM.

Part of the strategy was for Ritter’s administration to make the case for much slower “phased leasing”
of acreage on the Roan, as opposed to the BLM’s somewhat quicker but still limited and methodical approach. The governor’s Department of Natural Resources sought out (and found) a cheap economist who would be willing to put together a vague case that showed phased leasing was a better idea that would reap better revenues for the state. And can you guess who they asked to pay for said cheap economist? Yep—the Hewlett Foundation, with Hal Harvey more than happy to help out. In fact, Harvey wanted to help so much that he gave campaign contributions to both Salazars and Udall as well.
The congressmen worked at the federal level to implement Ritter’s phased leasing goals, with Sen. Salazar’s legal counsel begging for the suspect economic analysis to buttress his case. But the congressmen’s and Ritter’s efforts fell short of their goals, as BLM moved forward with the leasing, which netted nearly $114 million for both the federal and state governments—“the highest grossing onshore oil and natural gas lease sale in BLM history in the lower 48 states.”
Nevertheless, it’s a sorry tale of how environmental extremists will fight together to the death for measures that would cripple our access to our own sources of affordable energy.
Oct 31, 2008
“Global Warming” Has Stopped
Lord Christopher Monckton
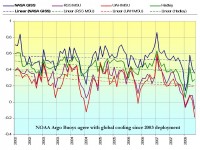
In a blog post, Bill Chameides says “global warming” is still happening. It isn’t. As the global temperature graph below shows, all four of the world’s major global surface temperature datasets (NASA GISS; RSS; UAH; and Hadley/University of East Anglia) show a decline in temperatures that have now persisted for seven years.
‘Global warming’? What ‘global warming’? All four of the world’s major surface temperature datasets show seven years of global cooling. The straight lines are the regression lines showing the trend over past seven years. It is decisively downward. Chameides’ graph overleaf appears to have been tampered with to exclude the very rapid cooling that occurred between 2007 (the curve stops in January 2007, when a strong El Nino artificially but temporarily boosted temperatures) and 2008. The fall in temperatures between January 2007 and January 2008, carefully not shown on Chameides’ graph, was the greatest January-January fall since records began in 1880.

See larger image here
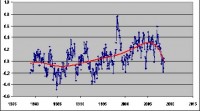
The UAH graph provides a complete answer to the Chameides’ attempt to suggest that skeptics” are confusing short-term and longer-term temperature changes. The year 2008 will turn out to have been no warmer than 1980 – 28 years ago. This is not a short-run change: the cooling trend set in as far back as late 2001, seven full years ago, and there has been no net warming since 1995 on any measure. Next, Chameides attempts to suggest that the recent cooling is caused by solar activity. He could well be right - however, if so, by the same token the warming that stopped in 1998 could also have been caused by solar activity - there was, after all, a solar Grand Maximum in the last 70 years of the 20th century, during which the sun was more active and for longer than at almost any previous similar period in the whole of the past 11,400 years.
Scafetta and West (2008) attribute more than two-thirds of the warming of the past 50 years to solar activity - the latest in a series of papers in all parts of the scientific literature that explicitly question the exaggerated estimates of climate sensitivity`perpetrated by the IPCC. Chameides’ final, desperate point is that the “green diamonds” he has so carefully selected from the 5-year running-mean graph that he has equally carefully blotted out show continuously-rising temperatures that overlay what he calls the short-term cooling.
Not so. As the first graph above shows, the linear regression not just for the past five years but for the past seven years shows a decisive and continuing cooling. Keenlyside et al. (2008) do not expect a new record year for global temperature to occur until at least 2015. If they are right, then the IPCC’s climate-sensitivity estimates must be - as Monckton (2008) finds them to be - prodigious exaggerations. False data will no longer convince any impartial mind to believe in the fantasy of anthropogenic “global warming”?

See larger image here
Oct 30, 2008
“Climate Smart” is Yesterday’s Vision
By Viv Forbes, Carbon Sense Coalition
Garbage out of Canberra:
Firstly, the Australian Treasury department has modeled the likely effect of the Emissions Trading Scheme on the Australian economy and assures us the costs will hardly be noticed. So we have IPCC General Circulation Models that have failed consistently to predict the world’s cooling temperature, and Federal Reserve Financial models that failed to predict the biggest financial collapse for 100 years, but we are asked to believe Australian Treasury Computer Models that say a massive new tax and dislocation of every important Australian industry will have no significant effect. And one of the adjustment factors used to achieve this Wong result for Minister Wong is the assumption that Australian industry will be able to buy foreign carbon credits much cheaper than they would be in Australia. So we pay big dollars to a Carbon Trader operating in Pakistan and Nigeria, he gets his mates to not cut down a forest they were planning to clear, and all is OK according to Minister Wong and her boffins with the computer.
Garbage out of London:
The irony - it snowed in London in October for the first time since, well opinions vary, some say 1934 some say 1922, but a long time anyway. The irony was not lost on those reporting the House of Commons debate on the global warming bill. Read the depressing saga and the result of the vote here.
And an Attempt to Clear some Garbage in Brisbane see this release:
“Climate Smart” is Yesterday’s Vision.
A statement by Viv Forbes, Chairman of the Carbon Sense Coalition. October 28, 2008
For Immediate Release.
The Carbon Sense Coalition today called on the Queensland Government to abandon their failed “Climate Smart” policy in favour of a new energy policy geared to the new realities of scientific re-assessment, economic austerity and international fragmentation. In a formal submission to the Queensland government, the Carbon Sense Coalition said that the tsunami of climate alarmism had reached its zenith.
As it recedes, a new climate of scientific scepticism and economic austerity will sweep green extremism from the political landscape. There will be no support for profligate spending on green baubles and beads, and no capacity for consumers or our basic industries to cope with the costs and dislocations of an Emissions Trading Scheme, especially as it becomes clear that nothing we can do will affect global temperatures.
The Queensland Government should forget party solidarity and instead stand up for the interests of the workers and consumers of tomorrows Queensland. These people want real industries producing useful goods and services and an end to “speculative waste” on feel-good causes like man-made global warming.
For more comment see: “Yesterday’s Vision” a submission covering all aspects of the Global Warming/Emissions Trading Debate.
Oct 30, 2008
Arctic Blast Brings London Earliest Snow in 70 Years. Cold and Snow in US Too!
By Mark Prigg, Science Correspondent
Londoners today woke up to the earliest snow cover for more than 70 years as a freezing blast of wind from the Arctic hit the capital. Some areas of north London saw two inches of snow fall in two hours when temperatures hit zero. Snow fell across much of the city from around 10pm, despite Met Office predictions that the city would escape the wintry showers that have swept across the north of England and Scotland leaving a thick covering.
In Brent, a heavy snow flurry caught residents by surprise as streets and cars were quickly covered in a white blanket. Graduate Charlotte Hussey, 21, said: “I was really excited and surprised, it was like Christmas had come early. I am going to go to the park today to build a snowman and go sledding.” Amid the snowfall, a man was taken to hospital after his car skidded off the M25 near Enfield. The Renault rolled over before landing in a ditch.
The cold snap with its widespread frost and crisp air is being caused by air from the Arctic replacing the normal south-westerly Atlantic breezes. “What we saw was the back edge of a weather system being blown down from the Arctic catching London,” said Byron Chalcraft, a Met Office forecaster. “The Arctic has been experiencing very cold temperatures this year, so it was an unusually cold front. Some unusual wind patterns meant it was blown over Britain very quickly, meaning the temperatures stayed very low. It is certainly very, very unusual to see snow in London this early,” said Mr Chalcraft. “The last time there was October snow [in the South-East] was in 1974, but the last time we actually had snow cover in October [in London], which we did late last night, was in 1934.” Read more here. See how this occurred on the same day the stubborn old fools in parliament passed the binding UK Climate Bill with 80% effect on emissions but zero effects on climate. See more on that ironic twist here.
It seems the louder the alarmists scream the colder the climate gets. If they keep it up, a new ice age is almost certain.
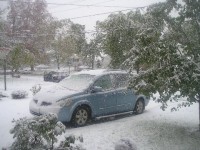
Here in the United States an arctic blast brought rare pre-Halloween heavy snows to parts of the east as far south as New Jersey and suburbs of Philadelphia. Up to 27” inches was reported in the Catskills. Here is a picture from Brunswick, New Jersey from a reader:

The snow extended down to North Carolina. See this video here.
The eastern cold reaches all the way down to southern Florida where Ft. Myers is expecting the coldest October temperatures in history (mid 40s). Read more here.
See the long list of record low temperatures set the last few days Oct_29_record_cold.pdf” title="here">here.
Oct 28, 2008
Scientists Challenge UK Government Climate Committee to ‘Drop Flawed Science’
CO2 Sceptics
Scientists Challenge UK Govt Climate Committee to ‘Drop flawed science and the Climate Change millstone - Save the economy’. CO2 is the Gas Of Life (’GOL’), it is not a problem.
The recommendation that the UK cut its greenhouse gas emissions by at least 80 per cent is “total madness based on false science” said Piers Corbyn of WeatherAction long range forecasters. “There is no evidence that Carbon dioxide has ever controlled, is controlling or will ever control world temperatures or climate and I challenge the promoters of this nonsense to produce evidence to justify their policies - or drop them, just as 13 world scientists have similarly challenged the UN.” Climate Change policy is a millstone around the UK and world economies. The beneficiaries are oil companies who ram up prices with abandon (taking advantage of limits placed on expansion of coal), bio-fuel producers who are increasing food prices and starvation, and the booming industry of climate change parasites such as carbon traders and nuclear power-mongers.
“Taxpayers and the developing world are the losers. There is a world recession now upon us which is being made deeper by Climate Change policies and the perpetrators must be called to account. Banks and industry are going bust yet the green fundamentalists want to impose more of this madness on the world. They actually want to increase their burden on the UK economy and deepen the world recession. “Genuine green policies to defend bio-diversity and reduce waste should be supported but the deceitful manipulation of the goodwill of many people in order to promote policies of mass taxation, expensive and dangerous energy like nuclear power and cuts in world living standards must be stopped. The UK and the world now need cheap energy solutions like coal to diesel technology which can be made smoke free. The danger for honest green campaigners - unless they break from the stranglehold of the Climate Change lobby - is that when the Global Warming swindle is exposed their spirited defence of nature will be forgotten too.
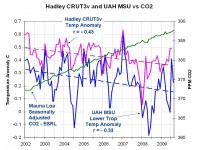
CO2 is no problem - it is the Gas of Life (GOL). The problem is Climate Change Policy - not Climate Change which is beyond man’s control. Global warming is over. World temperatures have fallen from their peak ten years ago while GOL (CO2) has been rising rapidly. The world was much warmer than now in the Bronze age 4,000 years ago and there was much less GOL (CO2) then. The bounteousness of world vegetation goes up with GOL. We need more GOL not less!”

See larger image here
Read more here. See Piers Corbyn follow up letter to congress here.
|


