Dec 14, 2007
Current Melting Of Greenland’s Ice Mimicks 1920s-1940s Event
Science Daily
Two researchers here spent months scouring through old expedition logs and reports, and reviewing 70-year-old maps and photos before making a surprising discovery: They found that the effects of the current warming and melting of Greenland’s glaciers that has alarmed the world’s climate scientists occurred in the decades following an abrupt warming in the 1920s.
Their evidence reinforces the belief that glaciers and other bodies of ice are exquisitely hyper-sensitive to climate change and bolsters the concern that rising temperatures will speed the demise of that island’s ice fields, hastening sea level rise.
The work, recently reported at the annual meeting of the American Geophysical Union in San Francisco , may help to discount critics’ notion that the melting of Greenland ‘s glaciers is merely an isolated, regional event. They recently recognized from using weather station records from the past century that temperatures in Greenland had warmed in the 1920s at rates equivalent to the recent past. But they hadn’t confirmed that the island’s glaciers responded to that earlier warming, until now. Read more here.
Icecap Note: This supports what we and others have been saying is that the changes observed are cyclical and related to the Atlantic Multidecadal Oscillation and not greeenhouse gases
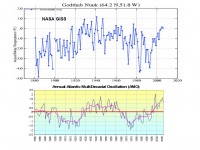
For full size image go here.
Dec 13, 2007
Magma May Be Melting Greenland Ice
By Karl Ritter, Associated Press
Global warming may not be the only thing melting Greenland. Scientists have found at least one natural magma hotspot under the Arctic island that could be pitching in.
clues to a new natural contribution to the melt arose when scientists discovered a thin spot in the Earthâs crust under the northeast corner of the Greenland Ice Sheet where heat from Earthâs insides could seep through, scientists will report here this week at a meeting of the American Geophysical Union.
The corner of Greenland where the hotspot was found had no known ice streams, the rivers of ice that run through the main ice sheet and out to sea, until one was discovered in 1991. What exactly caused the stream to form was uncertain. âIce streams have to have some reason for being there,â von Frese said, âand itâs pretty surprising to suddenly see one in the middle of the ice sheet.â The newly discovered hotspot, an area where Earthâs crust is thinner, allowing hot magma from Earth’s mantle to come closer to the surface, is just below the ice sheet and could have caused it to form, von Frese and his team suggest.
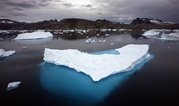
Ammassalik Island
âWhere the crust is thicker, things are cooler, and where itâs thinner, things are warmer,â von Frese explained. âAnd under a big place like Greenland or Antarctica, natural variations in the crust will makes some parts of the ice sheet warmer than others.â
Dec 12, 2007
Snowcover Increased Rapidly Even Before December
By Joseph D’Aleo, CCM
Even before the flurry of snow and ice storms in December, the hemispheric snowcover rapidly increased in November so by the end of the month (week 48 of the year), we were above the average shown in the red dashed line according to Rutger’s Snowlab. In fact we already ranked 15th highest in the 42 years records have been kept. With the snow so far this month and expected in the next week, we will rise in the rankings.
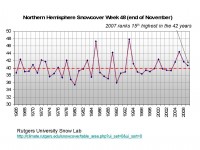
For a larger image go here.
Of course, the AGW PR machine picks these times when the last thing on people’s mind is global warming, as they sit in the dark and cold ice covered homes to issue press releases warning the arctic melting is accelerating with potentially disastrous consequences. The young scientists and agenda driven journalists and politicans have no sense of history. This has happened before - most recently in the 1930s to 1950s and relates to ocean warming cycles and not greenhouse gases. Never a mention of nor any explanation for the record high ice extent in Antarctica at the same time.
Let’s hope they return from their junket to Bali and find their driveway looking like this.
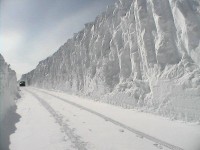
For larger image go here.
Dec 11, 2007
Whatever Happened to Solar Power?
By Michael Schirber, LiveScience
Over the course of a day, the amount of energy in sunlight striking the continental United States is more than 2,500 times the amount of the nation’s daily electricity consumption. Despite this potential, solar power is far behind other renewables, making up just 0.07 percent of the U.S. energy portfolio, according to the Department of Energy.
Almost all cells in current use are made of silicon. Although silicon is abundant in sand, it must be processed to make it usable in solar cells and computer chips. In fact, the current high demand from the electronics industry for silicon wafers has caused a shortage of high-grade silicon, which means the solar industry could have even more trouble trying to become competitive.
For a typical home’s electricity needs, the cost of solar panels is several tens of thousands of dollars. Over the lifetime of the panels, this works out to about 30 cents per kilowatt hour, three times what most utilities charge. To reduce this price, much of the current engineering effort is focused on making solar cells from thin films that either use less silicon or replace it with other photovoltaic materials. many experts think this should be the first goal of research and development.
Dec 07, 2007
USHCN National Weather Station Quality Plot
By Anthony Watts
Early in the project, one of the criticisms heard against the surfacestations.org effort was that there had been cherry picking going on in the selections of stations to survey, and that the project wasnt reaching a wide area. In this first map of its kind, one can clearly see the how the quality distribution of the 460 out of 1221 stations surveyed so far looks and that those claims werent valid. The results clearly show that the majority of USHCN stations surveyed so far have compromised measurement environments. The question then is this; have these mircosite biases been adequately accounted for in the surface temperature record?
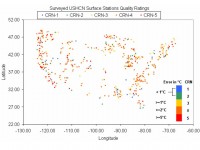
The 460 stations evaluated so far of the 1221 USHCN stations in the NCDC network. For larger image go here. For a pie chart of quality ratings go here.
Given that the generally agreed upon rise in surface temperature over the last century is approximately 0.8 degrees Centigrade, and seeing that the majority of climate monitoring stations have errors that are nearly equal to or larger than that value, the microsite bias errors are a cause for concern. Read more here.
|


