Jan 30, 2011
Scientist: Climate changes are not caused by greenhouse gases
Dr. van Andel on Hockey Schtick
Dr. Noor van Andel, former head of research at Akzo Nobel, has a new paper out showing the available data to date contradicts the notion of greenhouse gas induced global warming or ‘climate change.’ He notes that while there have been extensive efforts to ‘prove’ the ‘greenhouse’ warming theory by bringing computer models and observations into agreement, this has been done “strangely only by adjusting the measurements instead of adjusting the models,” in other words, via unscientific means. Dr. van Andel instead finds that ocean oscillations and the cosmic ray theory of Svensmark et al best explain climate changes.
CO2 and climate change
Noor van Andel
Abstract: It is shown that tropical Pacific sea surface temperature anomalies are closely congruent to global temperature anomalies, and that over more than a century. When we understand the cooling mechanism over the tropical Pacific, and especially its CO2 dependency, we can draw conclusions for the global CO2 climate sensitivity.
It is shown that the cooling of the tropics, or trade wind belt, is by deep convection, i.e. by a few thousand concentrated tropical thunderstorms that carry all the sensible and latent heat swept up by the trade winds all the way on to the tropopause. The physics of deep convection have been formulated since 1958 and are based on sound thermodynamics and measurements on location.
The trends of the temperature in the high atmosphere in the last half century are very negative, starting on this height where the convection reaches. That means that more CO2 has a cooling effect rather than a warming effect. Cloud tops radiate much more intense than the thin air on this height. This is the cause behind the cooling, as much as the CO2 increase.
The cooling trend is quite in discrepancy with the “greenhouse-gas-induced-global-warming” theory, but is quite in accord with increasing deep convection. The adjustment of these temperature measurements to bring them more in line with the climate models leads to unphysical conditions and processes. The response of the upper atmosphere temperature on volcanic eruptions also fits in the deep convection theory, but not in the mainstream theory.
Not CO2 increase, but two other parameters are the cause of climate change: ENSO or El Nino Southern Oscillation, a large change in the cold water upwelling along the coast of South America correlates well to short term climate change, and change in the intensity of hard, deeply penetrating Galactic Cosmic Radiation, well documented by 10Be deposits and 14C levels, correlates very well with long-term climate change including ice ages.
My conclusion is that climate changes are not caused by greenhouse gases.
selected excerpt from the paper (below, enlarged here):
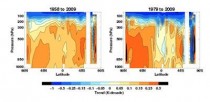
The global warming started in 1976 with the “big climate shift”, the trend stopped in 1999 but the climate stayed warm until 2010. We see that in the warming period 1079-2009 not only the warming trend at the surface is higher, but the cooling trend in the high tropical troposphere is more clearly enhanced. We see even a cooling trend 1979-2009 replacing a warming trend 1958-2009 at the tropical 500-800 hPa height. We could even conclude that more CO2 cools the climate, because it cools the upper regions where the deep convection reaches, increasing the effective lapse rate over the whole height with 0.35 K/decade, over 2 decades and 12 km that means 0.07*2/12=0.012 K/km, not much, but we see in the table that a 0.1 K/km lapse rate increase at SST -302K increases the convection top 1.5 km. So this CO2 cooling trend over 2 decades brings the convection top 1.5 km/0.1*0.012=180 m higher, which is not negligible.
This behavior has been a problem for many, as it contradicts the global-warming-by-greenhouse- gases theory. So there has been a large activity to bring models and observations into agreement, strangely only by adjusting the measurements instead of adjusting the models.
and from the paper’s conclusion:
Our present climate is due to an increased length of the last interglacial period, more than 10000 years, due to a low level of GCR [galactic cosmic rays] that maintains a low cloud cover, a low albedo, more absorbed sunshine and a pleasant climate. In the very long run, we need not mind about CO2 or global warming, but instead about higher GCR activity and global cooling. There is no way we can influence GCR activity, originating in active black holes and imploding supernovae.
h/t climategate.nl
See also Dr. van Andel’s highly recommended presentation to the Dutch Meterological Institute. H/T Robert Ferguson, Science and Public Policy Institute
Jan 28, 2011
Excellent Resource for Snowlovers: The Northeast Snowfall Impact Scale (NESIS)
NOAA NESDIS
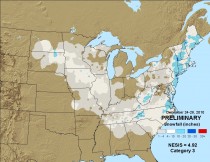
Storm of December 24-28, 2010, enlarged here.
The major winter storm that in late January affected the Mid-Atlantic and New England will soon be ranked according to the Northeast Snowfall Impact Scale, or NESIS. Developed by the National Weather Service’s own Paul Kocin and Louis Uccellini, NESIS characterizes and ranks high-impact Northeast snowstorms and gives an indication of a storm’s societal impacts.
Overview
While the Fujita and Saffir-Simpson Scales characterize tornadoes and hurricanes respectively, there is no widely used scale to classify snowstorms. The Northeast Snowfall Impact Scale (NESIS) developed by Paul Kocin and Louis Uccellini of the National Weather Service (Kocin and Uccellini, 2004) characterizes and ranks high-impact Northeast snowstorms. These storms have large areas of 10 inch snowfall accumulations and greater. NESIS has five categories: Extreme, Crippling, Major, Significant, and Notable. The index differs from other meteorological indices in that it uses population information in addition to meteorological measurements. Thus NESIS gives an indication of a storm’s societal impacts. This scale was developed because of the impact Northeast snowstorms can have on the rest of the country in terms of transportation and economic impact.
NESIS scores are a function of the area affected by the snowstorm, the amount of snow, and the number of people living in the path of the storm. The diagram below illustrates how NESIS values are calculated within a geographical information system (GIS). The aerial distribution of snowfall and population information are combined in an equation that calculates a NESIS score which varies from around one for smaller storms to over ten for extreme storms. The raw score is then converted into one of the five NESIS categories. The largest NESIS values result from storms producing heavy snowfall over large areas that include major metropolitan centers. For details on how NESIS scores are calculated at the National Climatic Data Center, see Squires and Lawrimore (2006).
NESIS categories, their corresponding NESIS values, and a descriptive adjective:

Table 2: Ranks 41 high-impact snowstorms that affected the Northeast urban corridor (go HERE to see this table with hyperlinks to maps of each storm)

References:
Kocin, P. J. and L. W. Uccellini, 2004: A Snowfall Impact Scale Derived From Northeast Storm Snowfall Distributions. Bull. Amer. Meteor. Soc., 85, 177-194
Squires, M. F. and J. H. Lawrimore, 2006: Development of an Operational Snowfall Impact Scale. 22nd IIPS, Atlanta, GA.
See story here.
Jan 26, 2011
Magnitude and Rate of Climate Changes
By Dr. Don J. Easterbrook
The GISP2 Greenland ice core has proven to be a great source of climatic data from the geologic past. Ancient temperatures can be measured using oxygen isotopes in the ice and ages can be determined from annual dust accumulation layers in the ice. The oxygen isotope ratios of thousands of ice core samples were measured by Minze Stuiver and Peter Grootes at the University of Washington (1993, 1999) and these data have become a world standard.
The isotope data clearly show remarkable swings in climate over the past 100,000 years. In just the past 500 years, Greenland warming/cooling
temperatures fluctuated back and forth about 40 times, with changes every 25-30 years (27 years on the average). None of these changes could have been caused by changes in atmospheric CO2 because they predate the large CO2 emissions that began about 1945. Nor can the warming of 1915 to 1945 be related to CO2, because it pre-dates the soaring emissions after 1945. Thirty years of global cooling (1945 to 1977) occurred during the big post-1945 increase in CO2.
But what about the magnitude and rates of climates change? How do past temperature oscillations compare with recent global warming (1977-1998) or with warming periods over the past millennia. The answer to the question of magnitude and rates of climate change can be found in the oxygen isotopes and borehole temperature data.
Temperature changes recorded in the GISP2 ice core from the Greenland Ice Sheet (Figure 1) (Cuffy and Clow, 1997) show that the global warming experienced during the past century pales into insignificance when compared to the magnitude of profound climate reversals over the past 25,000 years. In addition, small temperature changes of up to a degree or so, similar to those observed in the 20th century record, occur persistently throughout the ancient climate record.
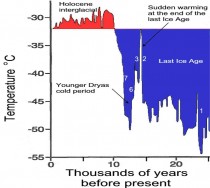
Figure 1. Greenland temperatures over the past 25,000 years recorded in the GISP 2 ice core. Strong, abrupt warming is shown by nearly vertical rise of temperatures, strong cooling by nearly vertical drop of temperatures (Modified from Cuffy and Clow, 1997).
Significance of previous global climate changes
If CO2 is indeed the cause of global warming, then global temperatures should mirror the rise in CO2. For the past 1000 years, atmospheric CO2 levels remained fairly constant at about 280 ppm (parts per million). Atmospheric CO2 concentrations began to rise during the industrial revolution early in the 20th century but did not exceed about 300 ppm. The climatic warming that occurred between about 1915 and 1945 was not accompanied by significant rise in CO2. In 1945, CO2 emission began to rise sharply and by 1980 atmospheric CO2. had risen to just under 340 ppm. During this time, however, global temperatures fell about 0.9F (0.5C) in the Northern Hemisphere and about 0.4F (0.2C) globally. Global temperatures suddenly reversed during the Great Climate Shift of 1977 when the Pacific Ocean switched from its warm mode to its cool mode with no change in the rate of CO2 increase. The 1977-1998 warm cycle ended in 1999 and a new cool cycle began. If CO2 is the cause of global warming, why did temperatures rise for 30 years (1915-1945) with no significant increase in CO2? Why did temperatures fall for 30 years (1945-1977) while CO2 was sharply accelerating? Logic dictates that this anomalous cooling cycle during accelerating CO2 levels must mean either (1) rising CO2 is not the cause of global warming or (2) some process other than rising CO2 is capable of strongly overriding its effect on global atmospheric warming.
Temperature patterns since the Little Ice Age (~1300 to 1860 A.D.) show a very similar pattern; 25–30 year–long periods of alternating warm and cool temperatures during overall warming from the Little Ice Age low. These temperature fluctuations took place well before any significant effect of anthropogenic atmospheric CO2.
Conclusions
Temperature changes recorded in the GISP2 ice core from the Greenland Ice Sheet show that the magnitude of global warming experienced during the past century is insignificant compared to the magnitude of the profound natural climate reversals over the past 25,000 years, which preceded any significant rise of atmospheric CO2. If so many much more intense periods of warming occurred naturally in the past without increase in CO2, why should the mere coincidence of a small period of low magnitude warming this century be blamed on CO2?
Read and see a lot more detail in this SPPI post here.
Jan 24, 2011
Five Reasons the Planet May Not Be Its Hottest Ever
Global warming is in full swing, say some of the world’s climatologists. Or is it?
On Thursday the U.N.’s weather agency announced that 2010 was a milestone, the warmest year on record, in a three-way tie with 2005 and 1998. “The 2010 data confirm the Earth’s significant long-term warming trend,” said Michel Jarraud, the World Meteorological Organization’s top official. He added that the ten warmest years after records began in 1854 have all occurred since 1998.
But how reliable is the data? Here are five good reasons some scientists are skeptical of these claims.
1. Where does the data come from? Average temperatures globally last year were 0.95 degrees Fahrenheit (0.53 Celsius) higher than the 1961-90 mean that is used for comparison purposes, according to the WMO—a statement based on three climate data sets from U.K. and U.S. weather agencies. They gather readings from land-based weather and climate stations, ships and buoys, and satellites—and they’ve come under dramatic scrutiny in recent years.
The land data is being challenged extensively by Anthony Watt on his SurfaceStations.org website. Watts recently graded 61% of the stations used to measure temperature with a D—for being located less than 10 meters from an artificial heating source. Many climate skeptics also take issue with NASA and NOAA, the U.S. agencies that gather U.S. climate data, but also manipulate and “normalize” it.
Satellite data is arguably the most accurate way to measure temperature. Roy Spencer, a climatologist and former NASA scientist, takes issue with the way that data is normalized and adjusted, instead presenting raw, unadjusted data on his website. The WMO does not use this data.
Watts pointed FoxNews.com to a new, peer-reviewed paper that looks at the reliability of the land-based sensor network, concluding that “it is presently impossible to quantify the warming trend in global climate.”
2. There’s less ice is in the oceans. Or more. Or something. The WMO report notes that Arctic sea-ice cover in December 2010 was the lowest on record, with an average monthly extent of 12 million square kilometers, 1.35 million square kilometers below the 1979-2000 average for December. The agency called it the third-lowest minimum ice extent recorded in September.
In fact, the overall sea-ice record shows virtually no change throughout the past 30 years, argued Lord Monckton, a British politician, journalist, and noted skeptic of global warming. He points out that “the quite rapid loss of Arctic sea ice since the satellites were watching has been matched by a near-equally rapid gain of Antarctic sea ice.”
When the summer Arctic sea ice reached its lowest point in the 30-year record in mid-September 2007, just three weeks later the Antarctic sea extent reached a 30-year record high, Monckton said.
3. El Nino has been playing havoc with temperatures. Over the ten years from 2001 to 2010, global temperatures have averaged 0.46C (0.83F) above the 1961-1990 average, the report points out, calling these measurements “the highest ever recorded for a 10-year period since the beginning of instrumental climate records.” The WMO notes that warming has been especially strong in Africa, parts of Asia, and parts of the Arctic.
Of course temperatures are up, said Joe Bastardi, a meteorologist with Accuweather: It’s El Nino, stupid.
“El Ninos cause spikes up. La Ninas drop it down,” Bastardi told FoxNews.com. “Why have we gone up overall in the past 30 years? Because we’ve been in a warm cycle in the Pacific,” he said. “But the tropical Pacific has cooled dramatically, and it’s like turning down your thermostat—it takes a while, but the house will cool.”
Japan’s Meteorological Agency agrees with Bastardi’s conclusion, stating recently that “it can be presumed that the high temperatures in recent years have been influenced by natural climate fluctuations with the periods ranging from several years to several decades,” as well as by greenhouse gases including CO2.
Icecap Note: 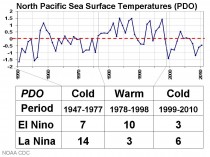
El Ninos are more frequent above (enlarged here) and longer below (enlarged here) in the PDO warm phase. La Ninas exhibit the same frequency and length dominance in the cold phase.
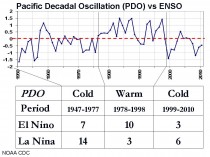
“This year’s warming can also be attributable to an El Nino event which lasted from summer 2009 to spring 2010,” the agency said.
4. Besides, it’s getting chilly. 2010 may have been a warm year, but 2011 has been off to a very cold start—and may be among the coldest in decades.
“December 2010 was the second-coldest December in the entire history dating back to 1659,” noted Steve McIntyre, a climate scientist and the editor of climate blog Climate Audit. He bases his claim on data from the longest continuous record in the world, kept by The Met Office, the U.K.’s official weather agency.
It’s an odd fact, one Bastardi thinks is telling. He said that the transition from the El Nino warming period into the La Nina cooling period will herald a crash of global temperatures, normalizing world heat levels—especially when analyzed via Spencer’s satellite data charts.
“If we look at the last 30 years, then the coming 30 years will cool back to where we were in the late 70s,” he said. “Look at it this way. Suppose you didn’t have a scale until 3 weeks ago. Every day for the last 3 weeks you weigh yourself and you are 175 or so. One morning you are 175.1 How much weight have you gained?”
You’re the heaviest you have ever been, right? “If you weren’t weighing yourself before, or were using a different scale, can you really say this is the heaviest ever?” he asked.
5. Forecasts are often wrong. Predicting the weather—especially a decade or more in advance—is unbelievably challenging. In 2000, a scientist with the Met Office’s Climatic Research Unit declared that within ten years, snowfall would be “a very rare and exciting event.”
And in 1970 at the first Earth Day event, one researcher predicted that the planet would be 11 degrees colder by the year 2000. Post here.
Jan 24, 2011
Data interpreted both ways
By G.R. Morton, The Migrant Mind
Contrary to claims of many modern Holocene denying climate hysteriacs, the 1970s did have a number of writers who beleived that the world was going to cool down. Among these were Stephen Schneider, the founder of the Climate Project at the National Center for Atmospheric Research. He wrote:
“I have cited many examples of recent climatic variability and repeated the warnings of several well-known climatologists that a cooling trend has set in-perhaps one akin to the Little Ice Age-and that climatic variability, which is the bane of reliable food production, can be expected to increase along with the cooling.” Stephen Schneider, The Genesis Strategy, (New York: Plenum Press, 1976), p. 90
Notice that Schneider says climate variability is caused by the cooling. Schneider eventually became a global warming alarmist but back in the 1970s when he wrote the above, he also wrote:
“The Dramatic importance of climatic changes to the world’s future has been dangerously underestimated by many, often because we have been lulled by modern technology into thinking we have conquered nature. But this well-written book points out in clear language that the climatic threat could be as awesome as any we might face and that massive world-wide actions to hedge against that threat deserve immediate consideration. At a minimum, public awareness of the possibilities must commence, and Lowell Ponte’s provacative work is a good place to start.” Book jacket endorsement of Lowell Ponte’s, The Cooling, (Englewood Cliffs: Prentice-Hall, 1976)
I point this out to show that at that time the hysteria was on cooling, at least as far as Schneider was concerned. I also point this out to verify that this book was within the mainstream of climatological thought at that time. This makes the following passage from Ponte’s book interesting, at least to me.
In countering the claim that a heat wave disproved global cooling, Ponte relates:
“But as Dr. Lamb pointed out calmly, such heat waves have accompanied every past global cooling and are to be expected. A high-pressure zone blocked warm air and chilled the North Atlantic. Now another hihg-pressure zone was blocking cold air and bringing extremes of heat into Europe. But such blocks were both symptoms of a cooling climate. Such cooling, he said, ‘means more volatile weather. It will be more hot, more cold, more wet and more dry, just as it was in the seventeenth century.’” Lowell Ponte, The Cooling, (Englewood Cliffs: Prentice-Hall, 1976), p. 40
Back then global cooling explained everything, hot, cold, wet or dry. Cooling was everything.
But today things are soooo different. we are so much better. Today global warming explains cold, hot, wet and dry.
The alarmists have just changed horses, not the need for alarm.
Here is the concluding statement from a climate blog advocating global warming alarmism.
According to the scientists at NOAA, the extreme weather of 2010 may very well be the “new normal.” Hotter, colder, wetter, drier. And way beyond inconvenient. See here.
Yep now instead of global cooling causing every kind of weather imaginable it is now global warming. As Ecclesiastes says, there is nothing new under the sun.
Even academic literature is littered with the idea that global warming is a universal causation of everything, hot cold, wet and dry.
“Our results indicate that fine-scale snow albedo effects influence the response of both hot and cold events and that peak increases in extreme hot events are amplified by surface moisture feedbacks. Likewise, we find that extreme precipitation is enhanced on the lee side of rain shadows and over coastal areas dominated by convective precipitation. We project substantial, spatially heterogeneous increases in both hot and wet events over the contiguous United States by the end of the next century, suggesting that consideration of fine-scale processes is critical for accurate assessment of local- and regional-scale vulnerability to climate change”.
Noah S. Diffenbaug, et al, “Fine-scale processes regulate the response of extreme events to global climate change,” PNAS, 102(2005):p. 15744. That article was edited by Stephen Schneider. “Conservation group WWF has blamed climate change for the coldest August in Sydney for more than 60 years. The freezing temperatures are proof of the urgent need to cut carbon pollution, according to WWF development and sustainability program manager Paul Toni.” “We can expect more extremes in climate,” Mr Toni said.
A senior engineer from National Climate Center, Ren Fumin told Beijing Times: “The severe coldness this winter can be called an extreme weather event. The direct reason for this is the atmospheric circulation anomaly. The main reason is the emergence of new EI Nino Phenomenon caused by global warming.” ”Weather expert: Extreme cold weather in N China caused by global warming” January 7, 2010
As if no El Nino’s ever occurred before the 1900s. What a laugh.
“‘Even though this is quite a cold winter by recent standards it is still perfectly consistent with predictions for global warming,’ said Dr Myles Allen, head of the Climate Dynamics group at Department of Physics, University of Oxford.” Richard Alleyne ”Snow is consistent with global warming, say scientists” The Telegraph Jan 23, 2011
The article this is from has the following as the teaser,
“Britain may be in the grip of the coldest winter for 30 years and grappling with up to a foot of snow in some places but the extreme weather is entirely consistent with global warming, claim scientists.” Richard Alleyne ”Snow is consistent with global warming, say scientists” The Telegraph Jan 23, But cold as well as hot as well as wet as well as dry can be due to global cooling or global warming, whatever explanation is needed.
See post here.
|


