Dec 07, 2007
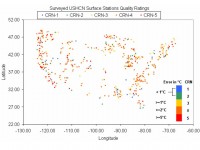
USHCN National Weather Station Quality Plot
By Anthony Watts
Early in the project, one of the criticisms heard against the surfacestations.org effort was that there had been “cherry picking” going on in the selections of stations to survey, and that the project wasn’t reaching a wide area. In this first map of it’s kind, one can clearly see the how the quality distribution of the 460 out of 1221 stations surveyed so far looks and that those claims weren’t valid. The results clearly show that the majority of USHCN stations surveyed so far have compromised measurement environments. The question then is this; have these mircosite biases been adequately accounted for in the surface temperature record?

The 460 stations evaluated so far of the 1221 USHCN stations in the NCDC network. For larger image go here. For a pie chart of quality ratings go here.
Given that the generally agreed upon rise in surface temperature over the last century is approximately 0.8 degrees Centigrade, and seeing that the majority of climate monitoring stations have errors that are nearly equal to or larger than that value, the microsite bias errors are a cause for concern. Read more here.
Dec 06, 2007
Reaction to David Whitehouse Solar Story
By Steve Milloy, DemandDebate.com
There is no ‘catastrophic warming’ for a solar minimum to ‘save’ us from and the trivial amount of warming from enhanced greenhouse will not be anything like sufficient to protect us from the downside of a quiescent sun. Cooling is inevitable and it is something to worry about, unlike gorebull warming.
In ways not well understood solar changes are amplified in our climate—Sol has been active and the planet has warmed a little but that appears to be over. Now Sol is going quiet and that could result in our cooling far more than will be comfortable trying to feed our now-larger population.
PREDICTION: reduced solar activity will result in oceanic cooling and increased absorption of atmospheric carbon dioxide. Rate of increase will fall, possibly even go negative and carbon scammers will claim this as evidence of the success of the UNFCCC & IPCC, regardless of most parties’ failure to implement any of the self-destructive actions required under various iterations of The Protocols.
PROMISE: carbon scammers will need to hang on to their ill-gotten gains because JunkScience.com is investigating ways of suing the “global warming” and carbon reduction industry collectively and individually for crop losses, hunger, storm damage, disease and loss of life in a cooler world. From offsetters to junket bunnies, we intend to nail all the frauds’ hides to the wall—but not until we’ve made sure they haven’t kept one thin dime extracted from politicians and a frightened public through this absurd scare.
Dec 06, 2007
Prominent Scientist Accuses IPCC of Falsifying Sea Level Data
By ReasonMcLucus in UK Telegraph
According to Swedish paleogeophysicist Nils-Axel Mörner, who’s been studying and writing about sea levels for four decades, the scientists working for the IPCC have falsified data and destroyed evidence to incorrectly prove their point. The IPCC choose Hong Kong, which has six tide gauges, and they choose the record of one, which gives 2.3 mm per year rise of sea level. Every geologist knows that that is a subsiding area. It’s the compaction of sediment; it is the only record which you shouldn’t use.
When you measure it by satellite. From 1992 to 2002, the graph of the sea level was a straight line, with absolutely no trend whatsoever. In the IPCC report suddenly it changed, and showed a very strong line of uplift, 2.3 mm per year, the same as from the tide gauge. They entered a “correction factor,” which they took from the tide gauge. Read more here.
Morner accused them of this at the Academy of Sciences in Moscow and they answered, that we had to do it, because otherwise we would not have gotten any trend!
Dec 05, 2007
Can the Sun Save Us from Global Warming?
By David Whitehouse, The Independent
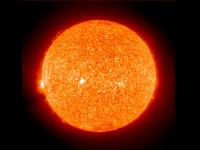
Astronomers are watching the Sun, hoping to see the first stirrings of cycle 24. It should have arrived last December. The United States’ National Oceanic and Atmospheric Administration predicted it would start in March 2007. Now they estimate March 2008, but they will soon have to make that even later. The first indications that the Sun is emerging from its current sunspot minimum will be the appearance of small spots at high latitude. They usually occur some 12-20 months before the start of a new cycle. These spots haven’t appeared yet so cycle 24 will probably not begin to take place until 2009 at the earliest. The longer we have to wait for cycle 24, the weaker it is likely to be. Such behaviour is usually followed by cooler temperatures on Earth.

The tardiness of cycle 24 indicates that we might be entering a period of low solar activity that may counteract man-made greenhouse temperature increases. Some members of the Russian Academy of Sciences say we may be at the start of a period like that seen between 1790 and 1820, a minor decline in solar activity called the Dalton Minimum. They estimate that the Sun’s reduced activity may cause a global temperature drop of 1.5C by 2020. This is larger than most sensible predictions of man-made global warming over this period. Read more here.
Dec 01, 2007
2007 Blown Off Track: Northern Hemisphere Historic Cyclone Inactivity
By Ryan Maue, FSU as a post on Climate Audit
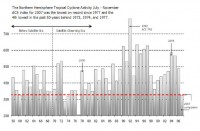
As reported at Climate Audit at the end of October, the North Atlantic was not the only ocean seeing quiet tropical cyclone activity. When using the ACE cyclone energy scale, the Northern Hemisphere as a whole is historically inactive. How inactive? One has to go back to 1977 to find lower levels. Even more astounding, 2007 will be the 4th slowest year in the past half-century (since 1958).
The 2007 Atlantic Hurricane season did not meet the hyperactive expectations of the storm pontificators. This is good news, just like it was last year. With the breathless media coverage prior to the 2006 and 2007 seasons predicting catastrophic swarms of hurricanes potentially enhanced by global warming a la Katrina, there is currently plenty of twisting in the wind to explain away the hyperbolic projections. The predominant refrain mentions something about “being lucky” and having “escaped” the storms, and “just wait for next year”.
When combined, the 2006 and 2007 Atlantic Hurricane Seasons are the least active since 1993 and 1994. When compared with the active period of 1995-2005 average, 2006 and 2007 hurricane energy was less than half of that previous 10 year average. The most recent active period of Atlantic hurricane activity began in 1995, but has been decidedly less active during the previous two seasons. When combined, the Eastern Pacific and the North Atlantic, which typically play opposite tunes when it comes to yearly activity (b/c of El Nino), brushed climatology aside and together managed the lowest output since 1977. In fact, the average lifespan of the 2007 Atlantic storms was the shortest since 1977 at just over two days. This means that the storms were weak and short-lived, with a few obvious exceptions.

See full size image and more on Climate Audit and on TC07 COAPS, Ryan Maue’s Homepage.
|


