Feb 15, 2015
Historic snows has ‘natural climate change’ deniers spinning
It was -2F Sunday in Boston and -3F pre-dawn Monday after the fourth major snowstorm in just over 3 weeks left behind 16.2 inches bringing the 23 day total to 90.2 inches. This may be the worst snow blitz since the Great Snows of 1717.
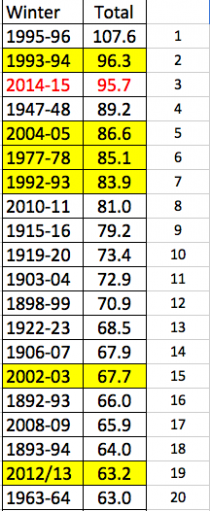
The total for the year is 95.7 inches, 3rd greatest for any season. It is just 0.6 behind 1993.94 (#2) and 11.9” behind the record of 107.6” (1995/96). The top 20 snow years are shown. the yellow years are the ‘analogs’ based on ocean, atmospheric and solar/lunar factors we used to predict a cold eastern winter this year and the historic one near the Great Lakes last year (7 of the top 20 years were analogs). Since we don’t have all the factors before 1950, we use analogs only after 1950. Some of the other years may have been good matches or analogs if we had that data for all the factors before 1950.
The average snow/melted ratio for the 4 big storms and the minor ones was about 18 to 1, which belies the idea the heavy snow was due to warm water hundreds of miles of the coast. Each of the major snows came with temperatures in the teens or lower. We have set records for February and any calendar month and likely snow depth (Blue Hill broke the 1995/96 record for snow depth).
And now areas to the south and west will get heavy snows and ice while the Great Lakes sits in frigid sub zero cold the next 10 days which is causing ice to increase rapidly approaching last year’s record.
_thumb.png)
Enlarged

Enlarged
Enlarged
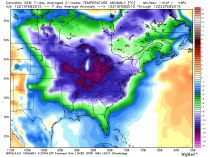
The warmists have proposed that global warming induced warming of the western Atlantic was responsible for the big Boston snows. Warm water they postulate means more moisture for snow and rain. While moisture feeds storms, you need contrast with very cold air to produce heavy snows and this year it is the cold that is driving the fluffy 90 inches of snow in Boston.
First of all as noted, the 90.2 inches of snow in the last 23 days in four nor’easters came from 5.02 inches of water. This 18 to 1 ratio is well above the normal 10-1 ratio in the ‘average storm. It is because the air is so cold with snow during the events falling with temperatures mostly in the teens.
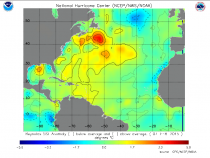
Also there is no evidence that the water just east of Cape Cod is 11.5 (21F) above normal as tweeted. NOAA’s National Hurricane Center Analysis showed water no more than 2 or 3C above normal well to the east of Cape Cod and with the very cold weather this month (over 11F below normal in the northeast), the water near the coast is colder than normal with ice forming. Ice is seen as far south as off the New Jersey Coast and will likely clog Boston and New York Harbor in the brutal cold of the next 10 days. Freezing spray warnings are in effect in the waters around NYC this morning.
Enlarged
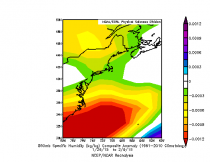
And the atmospheric water content (Specific Humidity) during the stormy period is BELOW NORMAL not above normal because the air is so cold on land and offshore.
Enlarged
Let me give you another example. The water off of Alaska has been warm the last two years.
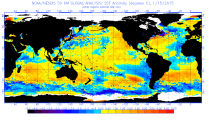
Enlarged
One who believes that drives heavy precipitation would surely believe this would generate well above normal snows in places like Anchorage in winter. Notice the snow this season to date has produced just 20 inches in Anchorage, 35 inches below normal.
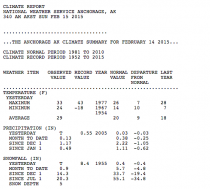
Enlarged
The Gulf of Alaska water on the other hand was very cold in 2011/12. Record snows fell in Anchorage with temperature 14.5F below normal. Record Bering Sea sea ice also occurred.
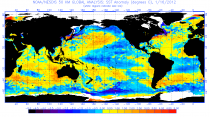
Enlarged

Enlarged
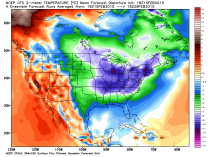
By the way Boston is rivaling February 1934 as the coldest month ever in Boston since 1872. So far, though today, Boston has averaged about 12.3F below normal for February. 1934 averaged -12.7F below normal. Some models are predicting the rest of the month to average 15F below normal, which would make this the coldest month of any month since 1872.
Jan 24, 2015
Update on snow and exceptional cold coming
Joe D’Aleo, Weatherbell.com
/
Indeed the models suggest a season’s worth of snow may fall in a 10 day period with near and then below zero temperatures between and following the storms.
Like in 2014, the middle of January saw a thaw after a frigid start. The last 10 days of the month turned frigid again. This year the thaw was a few days later and snow is forecast to mark the arrival of round two of the polar plunge. See the snow amounts forecast from the series of lows from the south and northwest. It will span the last 5 days of the month and start February. Come to weatherbell.com and see the high resolution European, UKMET, GFS and GEM models as well as the close up mesomodels including our own.
_thumb.png)
Enlarged
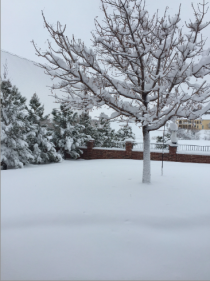
BTW, here is Amarillo, TX after 12 inches of snow with the southern system.
See the final storm and arctic front below.
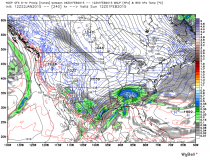
Enlarged
And the map with temperature anomalies (degrees C). Cold in the northeast is as much as 45F BELOW NORMAL!
_thumb.png)
Enlarged
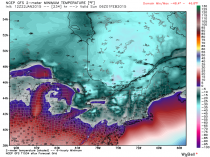
Enlarged
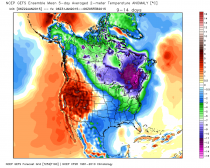
Here is the forecast the last 5 days of the month and then the first 5 of February (anomalies here in degrees C).
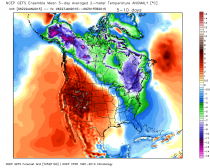
Enlarged
Enlarged
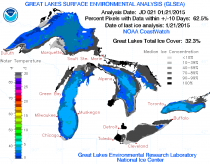
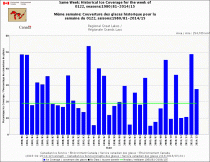
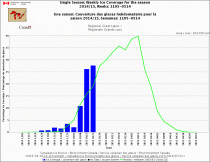
The Great Lakes ice spiked after a cold November but slowed in the warmth in later December before picking up in January. It has slows again the lat week, but the late month and February cold should ensure it is very close to 2014.
Enlarged
Enlarged
Enlarged
Jan 23, 2015
2014: A Year of Futility in the Fight against Climate Alarmism
By Steve Goreham
Reposted with author permission.
Despite activist public efforts on climate during the last year, actual events question the theory of human-caused warming.
Image from Wikimedia
CHICAGO, December 29, 2014 - The year 2014 was another year of futility in the fight against climate change. Climatists redoubled efforts to convince citizens that urgent action is needed to stop dangerous global warming. But the gap between public warnings and actual events produced an endless stream of climate irony.
January began with a frosty bang as an arctic air mass descended on the central United States, following a similar event in December. What was once called a cold snap is now ominously christened a “polar vortex.” Record-low daily temperatures were recorded from Minnesota to Boston, along with all-time seasonal snowfalls in many cities.
In a White House video released on January 8, John Holdren, chief science advisor to President Obama, made the paradoxical statement, “But a growing body of evidence suggests that the kind of extreme cold being experienced by much of the United States as we speak is a pattern that we can expect to see with increasing frequency as global warming continues.”
Also in January, passengers of the research ship Akademik Shokalskiy were rescued after the ship was locked in ice for 10 days near the antarctic coast. The expedition lead by professor Chris Turney had intended to study how weather patterns near Antarctica were changing due to man-made global warming.
On February 16, during a presentation in Indonesia, Secretary of State John Kerry stated that climate change was “perhaps the world’s most fearsome weapon of mass destruction.” Only two days later, protestors set fire to Kiev, the capital of Ukraine, leading to the resignation of President Viktor Yanukovych. In March, Russia seized the Crimea. In July, Malaysia Airlines Flight 17 was shot down over eastern Ukraine, and political unrest continues today. In the Middle East, slaughter of innocent civilians and beheading of western captives became a growing trend. Man-made climate casualties seem remarkably scarce in comparison.
In March, the Intergovernmental Panel on Climate Change of the United Nations released Climate Change 2014: Impacts, Adaptation, and Vulnerability, part of its Fifth Assessment Report. The report said that man-made climate change would reduce world agricultural output. Lead author Dr. Mark Howden stated, “There’s increasing evidence that climate change is also impacting on agriculture, particularly on some of the cereal crops such as wheat and maize. The negative impacts are greater and quicker than we previously thought.”
Meanwhile, farmers continued to ignore the warnings of the IPCC. According to the US Department of Agriculture, world agricultural production set all-time records for all three major cereal crops in 2014, with rice output up 1.1 percent, wheat up 11.2 percent, and corn up a whopping 14.0 percent over 2013.
The Obama administration continued its attack on coal-fired power plants, which provide about 40 percent of US electricity. In June, the EPA proposed new restrictions on carbon emissions that would make it vitually impossible to build a new coal-fired plant in the US. At the same time, more than 1,200 new coal-fired plants are planned across the world, with two-thirds to be built in India and China.
In his 2007 Noble Prize acceptance speech, former Vice President Al Gore warned that the arctic ice could be gone in “as little as seven years.” But arctic sea ice rebounded in 2014 and antarctic sea ice has been growing for decades. According to the University of Illinois, satellites measured global sea ice area at above the 30-year average at the end of 2014.
In September, the United Nations held a climate summit in New York City to urge the world to conserve energy and reduce emissions. Spokesman Leonardo DiCaprio stated, “This disaster has grown beyond the choices that individuals make.” Mr. DiCaprio neglected to mention his frequent flights on carbon-emitting private jets or his ownership of the world’s fifth largest yacht, purchased from a Middle East oil tycoon.
In October, climate skeptics reported the eighteenth straight year of flat global temperatures. Satellite data shows no temperature increase since 1997. The “pause” in global warming is now old enough to vote or to serve in the military.
Hurricanes and tornados are favored events for generating alarming climate headlines, but US weather events were few in 2014. US tornadic activity was below average and the lack of strong hurricanes continued. No Category 3 or stronger hurricane has made US landfall for more than eight years, the longest period since records began in 1900.
The last half of 2014 witnessed a steep drop in world petroleum prices from over $100 per barrel to under $60 per barrel. Hydraulic fracturing and horizontal drilling, technologies perfected by US geologists and petroleum engineers over the last two decades, produced an explosion in US oil production and triggered the fall in world prices.
But the concurrent drop in US gasoline prices to two dollars per gallon is not welcomed by man-made global warming believers. Former Energy Secretary Stephen Chu said in 2008, “So we have to figure out how to boost the price of gasoline to the levels in Europe.” English journalist George Monbiot has lamented, “We were wrong about peak oil: there’s enough in the ground to deep-fry the planet.”
With all the climate fun in 2014, what will 2015 hold?
Steve Goreham is Executive Director of the Climate Science Coalition of America and author of the book The Mad, Mad, Mad World of Climatism: Mankind and Climate Change Mania.
Read more at http://www.commdiginews.com/featured/2014-year-of-futility-in-the-fight-against-climate-change-32500/#fYbUUI6GPFS4EG45.99
Jan 22, 2015
CNN: 57% Of Americans Say Global Warming Is Not A Threat
By Michael Bastach
Is this the new climate consensus? More than half of Americans say global warming is not a threat to their way of life, according to a CNN poll. Furthermore, nearly half of Americans say global warming is caused by natural forces or isn’t a proven fact.
CNN’s poll reveals that a “majority of those polled, at 57 percent, say global warming will not pose a serious threat to their way of life,” and that only 43 percent “expect global warming to threaten them.”
“Meanwhile, only 50 percent of Americans believe global warming is caused by man-made emissions, while 23 percent say it’s caused by natural changes and 26 percent say it isn’t a proven fact,” CNN notes.
CNN’s poll comes as Democratic lawmakers and environmentalists are trying to stop Congress from passing a bill that would approve the Keystone XL oil pipeline, bringing oil sands from Canada to U.S. refineries on the Gulf Coast. Opponents of the pipeline argue it will only make global warming worse.
“Unless we get our act together, the planet that we’re going to be leaving to our kids and grandchildren will be significantly less habitable than the planet we have right now,” Vermont socialist Sen. Bernie Sanders told MSNBC on Wednesday.
But it’s an argument that doesn’t seem to be resonating with the American people, as 57 percent of them don’t see global warming as a threat to their lives.
Democrats also have another problem: Fifty-seven percent of Americans also support building the Keystone XL pipeline while only 28 percent oppose it.
Some Democrats have recognized this and have changed their arguments from climate-focused ones to ones about the economics of the pipeline. Pipeline opponents have argued that low oil prices no longer make the project necessary, and that the oil sands will be exported and not benefit U.S. industry.
New York Democratic Rep. Carolyn Maloney said the pipeline would “help Canadian companies export their oil and it happens to be the filthiest energy form.”
“The proposed Keystone XL pipeline would transport Canadian tar sands oil - the dirtiest fuel on the planet - through America’s heartland to be refined and then shipped abroad,” said Danielle Droitsch, the Canadian director at the Natural Resources Defense Council.
Most energy experts disagree with the idea that oil sands will be shipped thousands of miles to the U.S. Gulf Coast - the area with the country’s largest concentrations of refining capacity - just to be sent overseas.
“It seems a stretch to believe that a crude oil marketing group would use the Keystone XL pipeline to take about 800,000 bpd of heavy crude to the world’s largest concentration of heavy coking capacity, and then bypass all that so it could put it on a ship and take it somewhere else for an additional $4 to $5,” Michael Wojciechowski, an energy analyst at Wood Mackenzie, told Reuters.
Most of the claims are based on UHI from bad sited stations. It was tht 9th warmest years according to the satellites and momostly because of a weak El Nino while the far eastern north Paciic was in a warm intradecadal cycle.
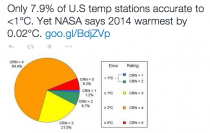
Oh BTW, the real motivation for alarmists is not a wory about people but another nefarious agenda.
Dec 27, 2014
After a brutal November, December was mild but January will rival January 2014!
Joseph D’Aleo, CCM
Update:
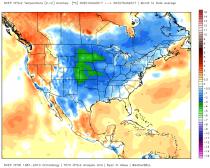
The month to date:
Enlarged
The typhoon Mekkhala is nearing the Philippines and about to recurve north. An old empirical rule is that a recurving typhoon leads to major trough amplification in the central and eastern United States about 10 days later.
_thumb.png)
Enlarged
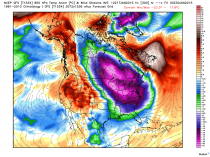
The models suggest January ends bitter cold with anomalies near 40F below normal (pink). This January will rivakl 2014 for US cold.
--------
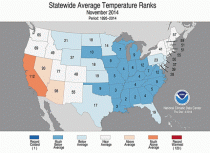
It was a November to Remember for winter lovers. It was the 16th coldest in the record back to 1895 with 18 states in the east and south in the top ten coldest. California was the exception with continued warmth. It was more like December than November. Natural gas prices soared 50%.
Enlarged
_thumb.png)
Enlarged
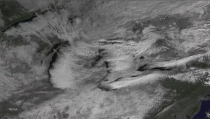
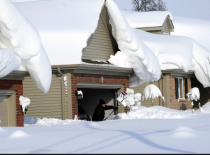
The lake effect machine was busy with oveer 6 feet of snow in places.
Enlarged
Enlarged
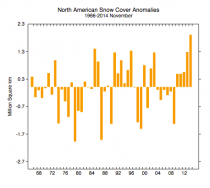
There was a rare Thanksgiving snowstorm with 50% snow cover extent at the peak, higher than Christmas on an average year. For North America, the snow extent was the highest in the record.
 Enlarged Enlarged
Then in December the cold gradually faded as westerly winds around a strengthening polar vortex in high latitudes ushered milder Pacific air into Canada and the United States. This helped bring rains and mountain snow to drought striken California but not much snow east and temperatures more like we might expect in November. With the mild temperature natural gas prices gave back all the gains from November.
_thumb.png)
Enlarged
Here is the vortex in the high atmosphere (stratosphere) which usually means maritime air dominates instead of polar.
_thumb.png)
Enlarged
In the most similar years to this one, this vortex broke down in late December and January and cold evolved. And indeed models suggest that happnes the next 10 days with an increased invasion of polar even Siberian air.
_thumb.png)
Enlarged
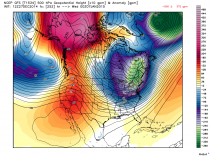
The lower atmosphere adjusts accordingly with the vortex coming south.
Enlarged

Enlarged
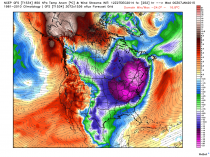
Look at the departures from normal of -36F in the east in this model. Please note the models are having great difficulty adjusting to the changes and are highly variable model to model and run to run.
Enlarged
We have a high confidence this change will occur but lower confidence on the details and timing. Once the arctic patterns readjust to the changes and the pattern stabilize, we would expect cold and storminess to prevail for an extended period. We cover this daily on Weatherbell.com which also has the highest resolution modeliing available even at the hobbyiest level.
|


_thumb.png)


_thumb.png)


_thumb.png)


_thumb.png)


_thumb.png)


_thumb.png)
_thumb.png)
_thumb.png)

