|
Oct 23, 2008
Global Cooling Continues
By Roger Helmer, Straight Talking

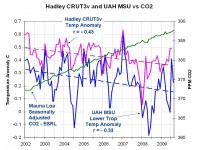
See larger image here.
This graph shows average global temperature records for the last five years from two of the world’s most respected meteorological institutes, the UK’s Hadley Centre, and the University of Alabama in the US. Both show a clear downward trend, and the graph contrasts that trend explicitly with the rising trend of atmospheric CO2. So we have two conclusions: first of all, Al Gore’s alarmist predictions of rapidly accelerating temperatures, run-away warming and imminent Armageddon are just plain wrong, with each year that passes adding more nails to the coffin of his disaster movie. Second, the supposed correlation between atmospheric CO2 levels and temperature just does not exist. For years, temperatures have been falling while CO2 levels have risen.
The alarmists will try to explain this by calling on short-term effects which temporarily disrupt a long-term cooling trend. But some scientists who accept the alarmist position are now suggesting that these “short-term effects” could continue for another ten years. How many decades have to pass before they recognise that they got it wrong, and that our climate mitigation policies represent a worse economic disaster than the current financial crisis?
Roger Helmer is a Conservative Member of the European parliament, and is also Honorary Chairman of The Freedom Association. He was first elected to the European parliament in 1999, and has been kept very busy ever since representing the interests of his 4.1 million constituents from in the East Midlands.In June 2004 he was re-elected for a second term, and currently sits on three committees: Environment, Unemployment and Petitions.
See Roger’s web site here.
Oct 20, 2008
Global Cooling? - ‘Thirty Years of Warmer Temperatures Go Poof’
By Lorne Gunter, National Post
In early September, I began noticing a string of news stories about scientists rejecting the orthodoxy on global warming. Actually, it was more like a string of guest columns and long letters to the editor since it is hard for skeptical scientists to get published in the cabal of climate journals now controlled by the Great Sanhedrin of the environmental movement. Still, the number of climate change skeptics is growing rapidly. Because a funny thing is happening to global temperatures—they’re going down, not up.
On the same day (Sept. 5) that areas of southern Brazil were recording one of their latest winter snowfalls ever and entering what turned out to be their coldest September in a century, Brazilian meteorologist Eugenio Hackbart explained that extreme cold or snowfall events in his country have always been tied to “a negative PDO” or Pacific Decadal Oscillation. Positive PDOs—El Ninos—produce above-average temperatures in South America while negative ones—La Ninas—produce below average ones.
Dr. Hackbart also pointed out that periods of solar inactivity known as “solar minimums” magnify cold spells on his continent. So, given that August was the first month since 1913 in which no sunspot activity was recorded—none—and during which solar winds were at a 50-year low, he was not surprised that Brazilians were suffering (for them) a brutal cold snap. “This is no coincidence,” he said as he scoffed at the notion that manmade carbon emissions had more impact than the sun and oceans on global climate.
Also in September, American Craig Loehle, a scientist who conducts computer modelling on global climate change, confirmed his earlier findings that the so-called Medieval Warm Period (MWP) of about 1,000 years ago did in fact exist and was even warmer than 20th-century temperatures. Prior to the past decade of climate hysteria and Kyoto hype, the MWP was a given in the scientific community. Several hundred studies of tree rings, lake and ocean floor sediment, ice cores and early written records of weather—even harvest totals and censuses --confirmed that the period from 800 AD to 1300 AD was unusually warm, particularly in Northern Europe.
But in order to prove the climate scaremongers’ claim that 20th-century warming had been dangerous and unprecedented—a result of human, not natural factors—the MWP had to be made to disappear. So studies such as Michael Mann’s “hockey stick,” in which there is no MWP and global temperatures rise gradually until they jump up in the industrial age, have been adopted by the UN as proof that recent climate change necessitates a reordering of human economies and societies. Dr. Loehle’s work helps end this deception.
Don Easterbrook, a geologist at Western Washington University, says, “It’s practically a slam dunk that we are in for about 30 years of global cooling,” as the sun enters a particularly inactive phase. His examination of warming and cooling trends over the past four centuries shows an “almost exact correlation” between climate fluctuations and solar energy received on Earth, while showing almost “no correlation at all with CO2.” Other international scientists have called the manmade warming theory a “hoax,” a “fraud” and simply “not credible.”
While not stooping to such name-calling, weather-satellite scientists David Douglass of the University of Rochester and John Christy of the University of Alabama at Huntsville nonetheless dealt the True Believers a devastating blow last month. For nearly 30 years, Professor Christy has been in charge of NASA’s eight weather satellites that take more than 300,000 temperature readings daily around the globe. In a paper co-written with Dr. Douglass, he concludes that while manmade emissions may be having a slight impact, “variations in global temperatures since 1978 ... cannot be attributed to carbon dioxide.” Moreover, while the chart below was not produced by Douglass and Christy, it was produced using their data and it clearly shows that in the past four years—the period corresponding to reduced solar activity—all of the rise in global temperatures since 1979 has disappeared. It may be that more global warming doubters are surfacing because there just isn’t any global warming. Read more here.
Oct 15, 2008
Let the Data Speak for Itself
By Bjorn Lomborg, UK Guardian
Have you noticed how environmental campaigners almost inevitably say that not only is global warming happening and bad, but also that what we are seeing is even worse than expected? If new facts constantly show us that the consequences of climate change are getting worse and worse, high-minded arguments about the scientific method might not carry much weight. Certainly, this seems to be the prevailing bet in the spin on global warming. It is, again, worse than we thought, and, despite our failing models, we will gamble on knowing just what to do: cut CO2 emissions dramatically.
But it is simply not correct that climate data are systematically worse than expected; in many respects, they are spot on, or even better than expected. That we hear otherwise is an indication of the media’s addiction to worst-case stories, but that makes a poor foundation for smart policies. The most obvious point about global warming is that the planet is heating up. It has warmed about 1C (1.8F) over the past century, and is predicted by the United Nations’ climate panel (IPCC) to warm between 1.6-3.8C (2.9-6.8F) during this century, mainly owing to increased CO2. An average of all 38 available standard runs from the IPCC shows that models expect a temperature increase in this decade of about 0.2C.

But this is not at all what we have seen. And this is true for all surface temperature measures, and even more so for both satellite measures. Temperatures in this decade have not been worse than expected; in fact, they have not even been increasing. They have actually decreased by between 0.01 and 0.1C per decade. On the most important indicator of global warming, temperature development, we ought to hear that the data are actually much better than expected.
Likewise, and arguably much more importantly, the heat content of the world’s oceans has been dropping for the past four years where we have measurements. Whereas energy in terms of temperature can disappear relatively easily from the light atmosphere, it is unclear where the heat from global warming should have gone - and certainly this is again much better than expected.
We hear constantly about how the Arctic sea ice is disappearing faster than expected, and this is true. But most serious scientists also allow that global warming is only part of the explanation. Another part is that the so-called Arctic oscillation of wind patterns over the Arctic Ocean is now in a state that it does not allow build-up of old ice, but immediately flushes most ice into the North Atlantic. Read more here.
Oct 15, 2008
Cold Pacific Brings Dramatic Cooling to Northwestern North America
By Craig Medred, Anchorage Daily News
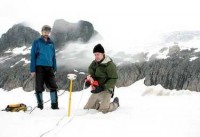
Two hundred years of glacial shrinkage in Alaska, and then came the winter and summer of 2007-2008. Unusually large amounts of winter snow were followed by unusually chill temperatures in June, July and August. “In mid-June, I was surprised to see snow still at sea level in Prince William Sound,” said U.S. Geological Survey glaciologist Bruce Molnia. “On the Juneau Icefield, there was still 20 feet of new snow on the surface of the Taku Glacier in late July. At Bering Glacier, a landslide I am studying, located at about 1,500 feet elevation, did not become snow free until early August.
“In general, the weather this summer was the worst I have seen in at least 20 years.” Never before in the history of a research project dating back to 1946 had the Juneau Icefield witnessed the kind of snow buildup that came this year. It was similar on a lot of other glaciers too. “It’s been a long time on most glaciers where they’ve actually had positive mass balance,” Molnia said. That’s the way a scientist says the glaciers got thicker in the middle.

Cold temperatures set several new record lows this weekend, including a low of 22 Saturday in downtown Pendleton, Oregon that broke a 118 year-old record of 24. Record lows started falling Thursday with a new low of 20 for Meacham, four degrees cooler than the previous record from 2006, according to information from the Web site for the National Weather Service Forecast Office in Pendleton.
In northern California, a record cold snap in Mendocino County over the weekend caused little damage to wine grapes but chilled the hearts of farmers who already have suffered huge losses this year. “It’s just one more thing on top of one more thing. You kind of hold your breath,” said Potter Valley wine grape grower Bill Pauli. Temperatures dropped to 31 degrees in the Ukiah Valley on Saturday night and early Sunday morning, the coldest Oct. 12 morning since record keeping began in Ukiah in 1893, said Troy Nicolini, a meteorologist with the National Weather Service in Eureka. The previous record was 34 degrees in 1916.
Farmers in Redwood Valley and other cooler regions in Mendocino County reported temperatures as low as 27 degrees. An estimated 30 percent to 50 percent of that county’s wine grape crop had yet to be harvested when the frost hit, killing the tops of unprotected vines and effectively freezing the ripening process.
Oct 14, 2008
West Antarctic Ice Sheet
By CO2 Science on SPPI
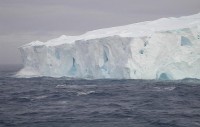
Is the West Antarctic Ice Sheet (WAIS) growing or shrinking? Climate alarmists would have everyone believe that it is rapidly disappearing; while the illuminati—Al Gore and James Hansen—prophetically proclaim that we have but a few short years in which to (1) repent of our profligate usage of fossil fuels, (2) preserve the ice at the planet’s southern pole by curbing our appetite for fossil-fuel energy and stopping global warming, and (3) avoid the catastrophic rise in sea level that would otherwise inundate the world’s coastal lowlands. But are these zealots correct in what they preach? In what follows, we briefly review the findings of several researchers who have focused their attention on the mass balance of the WAIS in an attempt to help reason prevail over rhetoric in this important but contentious war of words.

We conclude our Summary with a brief review of the paper of Krinner et al. (2007), who used the LMDZ4 atmospheric general circulation model (Hourdin et al., 2006) to simulate Antarctic climate for the periods 1981-2000 (to test the model’s ability to adequately simulate present conditions) and 2081-2100 (to see what the future might hold for the mass balance of the Antarctic Ice Sheet and its impact on global sea level). This work revealed, first of all, that “the simulated present-day surface mass balance is skilful on continental scales,” which gave them confidence that their results for the end of the 21st century would be reasonably skilful as well. Of that latter period a full century from now, they determined that “the simulated Antarctic surface mass balance increases by 32 mm water equivalent per year,” which corresponds “to a sea level decrease of 1.2 mm per year by the end of the twenty-first century,” which would in turn “lead to a cumulated sea level decrease of about 6 cm.” This result, in their words, occurs because the simulated temperature increase “leads to an increased moisture transport towards the interior of the continent because of the higher moisture holding capacity of warmer air,” where the extra moisture falls as precipitation, causing the continent’s ice sheet to grow.
The results of this study—based on sea surface boundary conditions taken from IPCC Fourth Assessment Report simulations (Dufresne et al., 2005) that were carried out with the IPSL-CM4 coupled atmosphere-ocean general circulation model (Marti et al., 2005), of which the LMDZ4 model is the atmospheric component—argue strongly against climate-alarmist predictions of future catastrophic sea level rise due to mass wastage of the Antarctic Ice Sheet caused by CO2-induced global warming. In fact, they suggest just the opposite, i.e., that CO2-induced global warming would tend to buffer the world against such an outcome.
And that seems to be the message of most of the other major studies of the subject as well. We have nothing to fear but fear itself ... plus Al Gore and James Hansen, who seem to be its chief purveyors. Read the very detailed CO2 Science survey here. See story on how Winds are the Dominant Cause of Greenland and Antarctic Ice Sheet Losses here.
|
|
|
|


