Jan 18, 2009
Divergence Between GISS and UAH since 1980
By Steven Goddard and Anthony Watts in Watts Up With That
Some of the excellent readers of the last piece we posted on WUWT gave me an idea, which we are following up on here. The exercise here is to compare GISS and satellite data (UAH and RSS) since the start of 2003, and then propose one possible source of divergence between the GISS and satellite data. The reason that the start of 2003 was chosen, is because satellite data shows a rapid decline in temperatures starting then, and GISS data does not. The only exception to the downward trend was an El Nino at the start of 2007, which caused a short but steep spike. Remembering back a couple of years, Dr. Hansen had in fact suggested that El Nino might turn into a “Super El Nino” which would cause 2007 to be the “hottest year ever.”
The last six years (2003-2008) show a steep temperature drop in the satellite record, which is not present in the GISS data. Prior to 2003, the three trends were all close enough to be considered reasonably consistent, but over the last six years is when a large divergence has become very apparent both visually and mathematically. See image below and larger here.
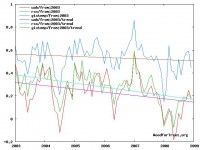
Since the beginning of 2003, RSS has been dropping at 3.60C/century, UAH has been dropping at 2.84C/century, and GISS has been dropping at 0.96C/century. All calculations are done in a Google Spreadsheet here.
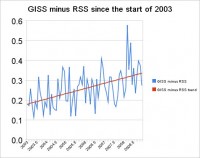
The divergence between GISS and RSS is shown below. Since the start of 2003, GISS has been diverging from RSS at 2.64C/century, and GISS has been diverging from UAH at 1.87C/century. RSS has been diverging from UAH at minus 0.76C/century, indicating that RSS temperatures have been falling a little faster than UAH over the last six years, as can also be seen in the graph above.
Below is a 250km map of GISS trends from 2003-2008. One thing which stands out is that GISS has large areas with sparse or no coverage. Notably in Africa, Antarctica, Greenland, Canada, Brazil, and a few other places.
Here are two images showing the difference between GISS global coverage in 1978 and 2008:
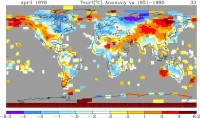
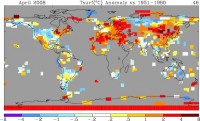
There is a tremendous amount of station dropout in 30 years. Dropout is worst in the high northern latitudes, most all of Canada, and about half of Africa. Of particular note is the red band at the southernmost latitude, which “seems” to indicate a continuous coverage there. Of course we know that is not true, given the paucity of stations in the Antarctic interior.
By contrast, while it doesn’t hit both poles (neither does GISS) UAH has much broader global coverage as seen here. Could this be part of the explanation for the divergence between GISS and satellite data? Read this post here and prior one by Steve Goddard on the Divergence GISS with UAH here.
Jan 16, 2009
Prediction of the May 2009 UAH MSU Global Temperature Result
By David Archibald
There are now 30 years of satellite data on global temperature. The graph below shows the University of Alabama Huntsville Microwave Sounding Unit (UAH MSU) results for the period 1978 to 2008.
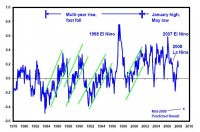
See larger image here.
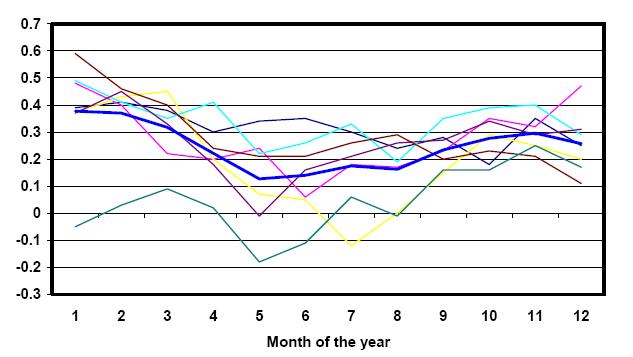
Examination of the record shows a change in character in 2001. Prior to that year, global temperatures tended to rise in a narrow band for a couple of years then have a relatively rapid fall. After 2001, temperatures tended to peak in January and then have a much wider annual range than previously. This is shown in the following graph:
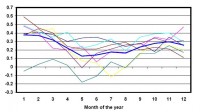
See larger image here.
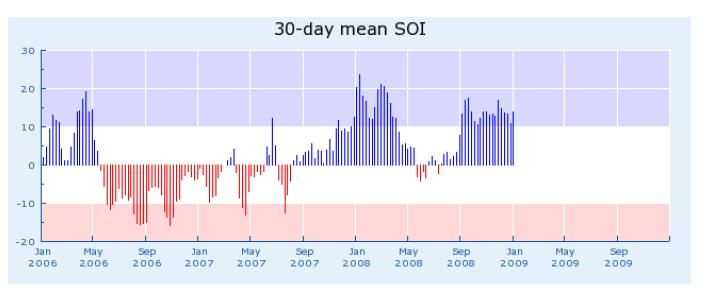
The above graph overlays the month to month results for the period 2002 to 2008, a total of seven years. The larger blue line is the average. For the last seven years, global temperature has tended to fall 0.3 of a degree between January and May, and then rise again to December. Departures from this are caused by El Nino and La Nina events. Just as the 2007 El Nino added 0.2C to the January 2007 result, the 2008 La Nina reduced temperatures in the first half of 2008 by 0.3C. The following figure shows the strength of the Southern Oscillation Index (SOI) which drives the formation of El Nino and La Nina events.
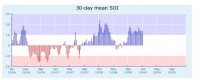
See larger image here.
Another large La Nina formed in late 2008. The combination of the annual pattern of temperature change and the current La Nina enables a short term forecast of the UAH MSU result to be made. The combination of a 0.3c response to the current La Nina and the usual 0.3C decline from January to May will result in a 0.6C decline to May 2009 to a result of -0.4C (0.4C below the long term average). See PDF here.
Let’s see if David can do better than the UKMO has done in recent years. UKMO is already talking a top 5 warmest 2009.
Jan 16, 2009
Weblog by Madhav Khandekar on Climate Science Site on Battisti Paper
By Roger Pielke Sr.
There is an article in Science [H/T to W. F. Lenihan!] Historical Warnings of Future Food Insecurity with Unprecedented Seasonal Heat
David. S. Battisti and Rosamond L. Naylor Science 9 January 2009: 240-244.
The abstract of this article reads: “Higher growing season temperatures can have dramatic impacts on agricultural productivity, farm incomes, and food security. We used observational data and output from 23 global climate models to show a high probability (>90%) that growing season temperatures in the tropics and subtropics by the end of the 21st century will exceed the most extreme seasonal temperatures recorded from 1900 to 2006. In temperate regions, the hottest seasons on record will represent the future norm in many locations. We used historical examples to illustrate the magnitude of damage to food systems caused by extreme seasonal heat and show that these short-run events could become long-term trends without sufficient investments in adaptation.”
An excellent weblog by Pat Michaels on this Science paper is also worth reading (see). Madhav Khandekar has e-mailed me on this article, and graciously accepted my invitation to post as a guest weblog his insightful comments on this paper. Dr. Khandekar is an Environmental Consultant (extreme weather events) and worked for 25 years with Environment Canada in Meteorology. His weblog follows.
“I read the abstract and summary of David Battisti’s article from Science and am very disappointed at his naive analysis of “hot” future climate and its possible adverse impact on world-wide and in particular tropical agriculture. I am afraid he ( David) has NOT tried to understand or analyze in depth how agriculture has evolved in most tropical regions.
From my analysis of agricultural evolution over south Asia (where more than 60% of humanity lives today) most regions have substantially increased their grain & food (fruits, veggies etc) supply in the last 25 years. Increase in max temp (due to GW) alone is NOT necessarily deleterious to agriculture in Asia and tropical Africa. Reduced rainfall (seasonal, Monsoonal) can be more deleterious to agriculture and so far there is NO indication that Monsoon or seasonal rains over Asia & tropical Africa have declined in the last 25 yrs. Allow me to provide some numbers: For India (I have done extensive analysis of Monsoon and agriculture for India) the rice yield has increased from 25 M tonnes in 1950 to about 100 M tonnes in recent yrs and most of India’s rice grows in the Peninsular India where mean temp has increased by about 1C over the past 50 yrs. During the Monsoon months mean temp is about 32/35C ( David refers to this as ‘critical’, which is NOT correct) but with good rains from Monsoon season, rice can grow quite well there. In the northern Province of Punjab ( India’s wheat growing region) wheat grows due to winter rains (December-March, about 6-10 cm) plus excellent irrigation (perhaps best in the world) and today Punjab produces about 70 M tonnes of wheat, compared to about 15 M tonnes in the 1950s. Besides wheat & rice India also produces a variety of other grains like beans, sorghum, soya, barley etc. India has two agricultural seasons, Kharif the main Monsoon season, June-Sept and Rabi, winter season Dec-Feb this only for selected regions of Peninsular India and parts of central & north India where irrigation is well developed. The two seasons’ total yield today can and does provide sufficient grains/fruits/veggies etc for 1.2 B people of India, this represents about 20% of world’s humanity!
In summary I completely disagree with David Battisti’s analysis of “reduced grain yield” in a warmer world! This issue is very poorly analyzed. For the year May 2007 thru April 2008, India’s total grain yield, per an article I read in May 2008, was estimated at about 230 M tonnes, possibly largest yield in the last ten years. I am afraid Battisti puts “too much” faith in his models.” When one closely analyzes the climate of India and south Asia, Battisti’s present study in Science seems deeply flawed. Read full post here.
Jan 14, 2009
All In
By Roger Pielke Jr.
It is a bit early in the year to staking out a position in the race for boneheaded move of the year in the climate wars, but NASA GISS has done just that but doubling down on its prediction that 2009 or 2010 will be the warmest on record. One might think that the surprising 2008 global temperatures (i.e., surprising to folks making short-term predictions at least) would motivate some greater appreciation for uncertainty. Not so. Here is what NASA GISS says:
“. . . in response to popular demand, we comment on the likelihood of a near-term global temperature record. Specifically, the question has been asked whether the relatively cool 2008 alters the expectation we expressed in last year’s summary that a new global record was likely within the next 2-3 years (now the next 1-2 years). . . Given our expectation of the next El Nino beginning in 2009 or 2010, it still seems likely that a new global temperature record will be set within the next 1-2 years, despite the moderate negative effect of the reduced solar irradiance.”
Joe Romm takes the startling position that the fortunes of climate policy may well depend on how temperature evolves over that period: “for better or worse, what happens to temperatures in the next few years may well affect just how much climate action that we are going to take”
Joe might ask why it is that short-term behavior of the climate system has political meaning. I have some ideas. Offering predictions of the evolution of global temperatures on timescales of years is foolish, (especially so when you also control the dataset used to evaluate the predictions). Explicitly associating the evoloution of temperatures with political outcomes on such a short timescale is also foolish.
Here are some tips for NASA GISS and advocates for action on carbon dioxide emissions:
1) Maybe we can predict the climate over timescales of one to two years, and maybe we can’t. Such forecasts should be viewed as highly experiemental, and the track record of such forecasts is not so good.
2) Accelerating decarbonization of the global economy makes good sense, regardless of the evolution of global temperatures over the next 1, 2 or 10 years. As my father and I wrote in 2006:
There is no greater danger to support for action on important issues of human impacts on the environment than an overselling of what climate science can provide. If the climate behaves in ways that are unexpected or surprising it will be more than just credibility that is lost. Advocates for action should think carefully when gambling with the unknown predictive abilities of climate models. The human influence on the climate system is real, but the climate may not always cooperate. Read more here.

Icecap Note: Today Lubos Motl posted on evidence than GISS was manually adjusting data (cheating) while the signature was not there for the satellite data sources. Anthony Watts took more of a wait and see position here. Ironically, the same day, as Andy Revkin posted today here, Hansen won the AMS 2009 Carl Gustaf Rossby Research Medal “for outstanding contributions to climate modeling, understanding climate change forcings and sensitivity, and for clear communication of climate science in the public arena.” It seems that with Tom Karl as its last President and now Hansen as an award winner, AMS needs only to find an award to provide Phil Jones to cover all three individuals that are manipulating the data to keep the global warming hoax alive and the grant gravy train funding for the universities and AMS going. Its another sad day and embarrassment for a once great society that has lost its way.
Jan 14, 2009
The Ice Age Cometh: Experts Warn of Global Cooling
By Jeff Poor, Business and Media Institute
’Lou Dobbs Tonight’ segment dismisses manmade global warming theory—‘effects of greenhouse gas have a small impact on climate change.’ If you’re fortunate enough to have it - don’t sell that oceanfront property for fear that the icecaps will melt, and rising seas swamping your property. A segment on CNN’s Jan. 13 “Lou Dobbs Tonight” explored the possibility that earth isn’t warming, but is, in fact, cooling.
Dobbs cited National Oceanic and Atmospheric Administration data dating back to 1880 which showed a spike in mean temperature over land and ocean. However, Joseph D’Aleo, the executive director of International Climate and Environmental Change Assessment Project (ICECAP) questioned that data by comparing it to more modern reliable satellite data, when ask if he “quibbled” with the NOAA data’s representation. “Yes, I do,” D’Aleo replied. “In fact, if you look at the satellite data, which is the most reliable data, the best coverage of the globe - 2008 was the 14th coldest in 30 years. That doesn’t jive with the tenth warmest in 159 years in the Hadley data set or 113 or 114 years in the NOAA set.”
D’Aleo’s organization, ICECAP, is one of 33 groups co-sponsoring The Heartland Institute’s 2009 International Conference on Climate Change in New York City March 8-10. D’Aleo also appeared on Dobbs’ program on Jan. 5 and said that a lot of the research promoting the theory of anthropogenic or manmade climate change is too short-sighted. According to D’Aleo, the spike in NOAA climate data is a result of location changes where the data is recorded. He contended that with the proportional increase of urban data used versus rural data, the overall effect was a warming trend. “Those global dat a sets are contaminated by the fact that two-third of the globe’s stations dropped out in 1990,” D’Aleo added. “Most of them rural and they performed no urban adjustment. And, Lou, you know, your people in your studio know that if they live in the suburbs of New York City, it’s a lot colder in rural areas than it is in the city. Now we have more urban effect in those numbers reflecting, that show up in that enhanced or exaggerated warming in the global data set.”
Another factor contributing to the global cooling period is the decline in sunspot activity according to Jay Lehr, a senior fellow and science director of The Heartland Institute. “[I] think more importantly it is to look at the sun’s output, and in recent years, we’ve seen very, very low sunspot activity, and we are definitely - in my mind - not only in a cooling period, we’re going to be staying in it for a couple of decades,” Lehr said.
Lehr said the cooling trend was a positive and hoped it would have and impact on legislators to resist the temptation to pass and sort of climate change regulation that could further hurt the U.S. economy. “And I see it as a major advantage, although I think we will be able to adapt to it, I’m hopeful that this change in the sun’s output will put some common sense into the legislature - not to pass any dramatic cap-and-trade or carbon tax legislation that will set us in a far deeper economic hole,” Lehr added. “I believe Mr. Obama and his economic team are well placed to dig us out of this recession in the next 18 months to two years. But, I think if we pass any dramatic legislation to reduce greenhouse gases, the recession is going to last quite a few more years and we’ll come out of it with a lower standard of living as a result on very tenuous scientific grounds.”
Lehr pointed out the “silliness” of not including the sun’s impact on the earth’s climate - a factor often neglected by many of the global climate change alarmist. He also cited CNN meteorologist Chad Myers, who said the theory of manmade global warming was “arrogant” on Dec. 18, 2008. “It just seems silly to not recognize that the earth’s climate is driven by the sun,” Lehr said. “Your Chad Myers about a month ago pointed out it’s really arrogant for mankind to think he controls the climate or the universe. Only 4 percent of our greenhouse gas is carbon dioxide. Ninety percent is water vapor which we have no impact over.” Lehr told Dobbs it would be a mistake to enact policy that was intended to reduce the amount of greenhouse gases in the atmosphere, as Obama’s Secretary of State designate Hillary Clinton suggested to the Senate Foreign Relations committee on Jan. 13 in her confirmation hearing that the incoming Obama administration intended to do. “And, if we were to try to reduce greenhouse gases with China and India controlling way more than we do and they have boldly said they are not going to cripple their economy by following suit, our impact would have no change in temperature at all,” Lehr added. “In Europe they started carbon cap and trade in 2005. They’ve had no reduction in greenhouse gases, but a 5 percent to 10 percent increase in the [cost of] standard of living. We don’t want to go that route.” Read more here.
|

