Aug 05, 2008
Winter and Spring Showed High Degree of Persistence
By Joseph D’Aleo, CCM, Fellow of the AMS on WSI’s Intellicast
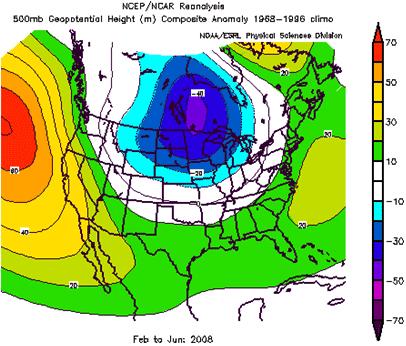
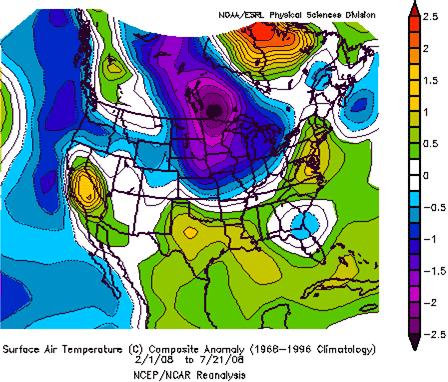
The winter and spring showed a great deal of persistence which is why anomalies were so large. Persistence tends to be high during stronger La Ninas and El Ninas as we have reported earlier. Solar minimums also tend to exhibit less variability as the 27 day solar cycle still evident at the minimum is not strong enough to produce pulses in the atmospheric teleconnections like the PNA and NAO as they do when the sun is more active with flares and eruptive disturbances. Look at the upper level pattern for the last 6 months.
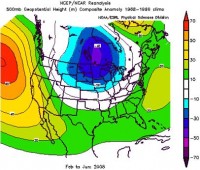
See larger image here
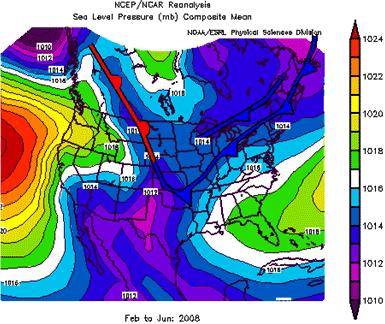
You can see clearly a central North America trough and ridges off the west coast and a weaker one off the east coast. The corresponding surface pattern has had the polar front in the mean dipping into the central states.
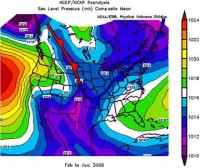
See larger image here
This is where the coldest air has been most persistent as would be expected.
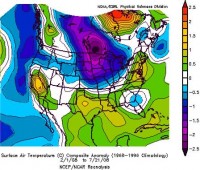
See larger image here
Storms moved along the boundary bringing heavy rains and flooding, heaviest from the central states into the northeast. High soil moisture provided a positive feedback to the cool and wet pattern just as dryness in the southwest helped perpetuate warmth and dryness there. All this even as La Nina faded. Severe weather also occurred with these storms producing frequent tornadoes and more deaths than in recent years. We discussed earlier in this is story how this is typical of La Nina. 120 have died as of 27th July. This is tragic but falls far short of the well over 300 that died in the big La Nina outbreaks of 1965 (Palm Sunday) and 1974 (the Superoutbreak) or the 800 that died in 1927. Of course part of this decline is the improved awareness and the onset in the 1950s of severe weather forecasts and warnings. However, if indeed we have moved into a cold PDO era with more La Ninas as we and others believe, we can expect more active tornado seasons.
We can as we also discussed in this April story, expect more cold northern snowy winters, more spring floods, summer heat and drought in La Nina onset years, more Atlantic basin and east coast landfalling hurricanes. See full story with more graphics here.
Aug 03, 2008
Clearing the Smog of Beijing with “Coal by Wire.”
By Viv Forbes, Chairman of the Carbon Sense Coalition
As the TV turns nightly to Beijing, we can expect chilling pictures and doomsday comments about the “Asian Pollution” and the “Beijing Smog”. This will induce media and political scaremongers to use these images to sell dud products like the “Carbon Pollution Reduction Scheme”. It is not carbon dioxide from burning coal that pollutes the skies of Asia and Africa. Carbon dioxide (CO2) is a naturally occurring, clean, invisible, beneficial gas. CO2 is an essential part of the natural world but a very minor trace constituent of our atmosphere. This trace amount of CO2 in the atmosphere is the aerial food store for all plants, and thus also sustains all animals, including humans. CO2 is a boon to life, not a pollutant.
Moreover, the claim that man’s emissions will cause dangerous global warming is strongly and increasingly disputed by scientists and is not supported by historical evidence. It also defies common sense to believe that such a minor natural gas can cause all the climate disasters that are blamed on it. We are about to hang an innocent hero. Asia’s visible pollution is largely caused by the crude and inefficient open air combustion of low quality fuels. It is caused by millions of open-air cooking fires in India, China, North Korea and Africa using scavenged fuels like cow dung, cardboard, wood, and low quality coal and coke; by thousands of backyard brickworks and small dirty furnaces along the Yangtze River and in other places; by forest clearing fires in Indonesia and bush and grass fires elsewhere; and by millions of small obsolete and dirty wood, charcoal and coal stoves, heaters, boilers and furnaces all over Asia and Africa. Similar pollution is obvious in places in South America. “Open fires” was the cause of similar smogs in England as recently as the 1950’s.
Open-air combustion of poor quality carbon fuels produces not only the harmless clean so-called “greenhouse” gases of water vapour and carbon dioxide, but also real pollutants such as soot, smoke, ash, dust, unburnt fuel and chemicals containing sulphur, chlorine, nitrogen, fluorine, and metals. In confined unventilated places, open fires can also produce the very poisonous gas, carbon monoxide - this is the one that will quickly kill the canary. China also emits more sulphur dioxide than anywhere else in the world. This chokes their people, causes acid rain and damages buildings.
England’s last and worst ever pollution event, “The Black Fog” of 1952, was triggered by a temperature inversion over London. Visibility was reduced to less than one foot and 4,000 Londoners died from SO2 poisoning (50 in one small London park alone). This shock brought action. Two things cleared the Big Smoke from London and Manchester. Firstly was the passage of the Clean Air Act in 1956 - cooking and heating with open fires of wood and coal was banned in big cities. But bans would not have worked without other better heating options. No matter what the laws say, people will use whatever fuel they can find to keep warm and cook their food. Londoners only stopped burning wood and coal in their homes when electricity and smokeless fuel came available. The government encouraged people to use electricity - it was called “Coal by Wire”.
This clean energy can be generated reliably 24 hours a day, using high quality coal in non polluting power stations located far from densely populated areas. It is then transported silently and cleanly with zero pollution and minimal loss of energy to deliver lighting, heating, cooling, cooking and motive power into the most humble home in the poorest suburb. It is the magic of the modern world. Today’s irrational and hysterical focus on harmless carbon dioxide by governments and media is misdirected and counter-productive. It is diverting attention and resources from damaging pollution which is altering local climate and affecting many areas of the world. And it is delaying the spread of coal powered electricity to many areas now desperate for clean invisible power. Read more here.
Aug 01, 2008
Warming Message Morphs as Earth Cools
By Joseph D’Aleo in the Washington Examiner
Global Warming Committee chair Rep. Edward Markey, D-Mass., recently told students gathered at the U.S. Capitol that climate change caused Hurricane Katrina. “There now is no question that this harm is being caused by human activity. It’s warming up the planet and melting the glaciers,” he said. “The planet is running a fever.”
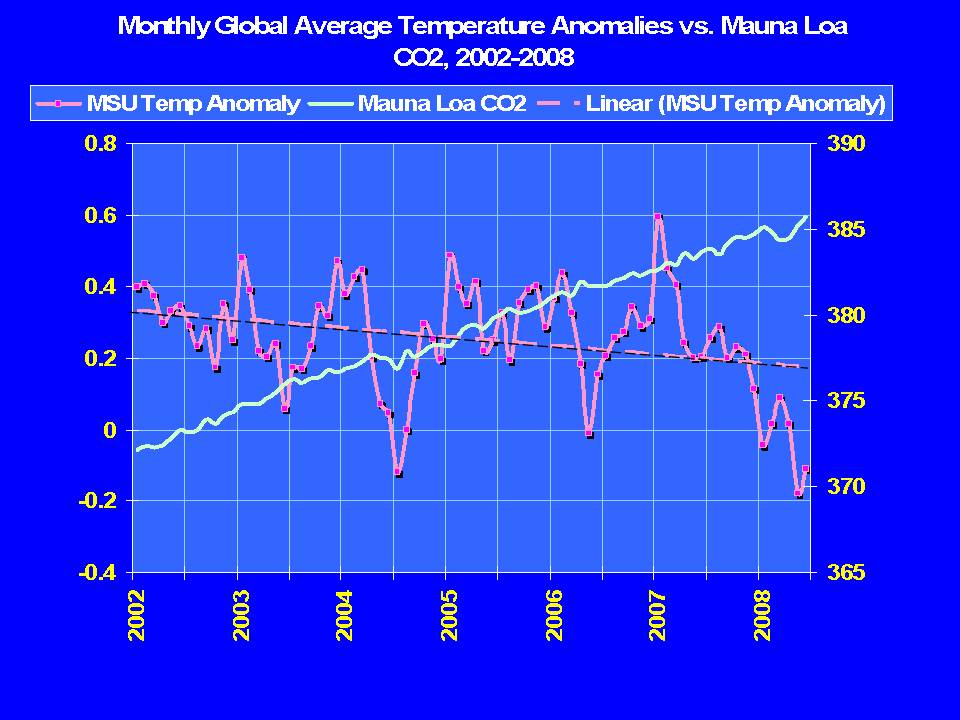
Markey was not aware that global temperatures stopped warming in 1998 and since 2002 have been declining. NASA’s Jet Propulsion Laboratory reported that the 3,000 global ARGO diving buoys they deployed in 2003 have shown that the world’s oceans have cooled, too (also here)
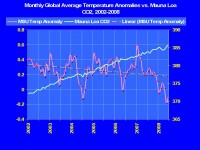
See larger graphic here
This cooling has occurred even as CO2 increased 3.5 percent. A similar decoupling took place from the 1940s to the late 1970s, when temperatures fell as CO2 accelerated upwards into the post-war boom years. This on-again, off-again correlation suggests CO2 is not the primary driver of climate.
Rep. Markey also was not aware that in a NOAA press release, hurricane specialist Chris Landsea stated: “There is nothing in the U.S. hurricane damage record that indicates global warming has caused a significant increase in destruction along our coasts.” MIT’s Kerry Emanuel, earlier a proponent of a global warming - hurricane link, published a new paper showing that even in a dramatically warming world, hurricane frequency and intensity may not substantially rise during the next two centuries.
Despite these new findings and defections, climate alarmists have adopted the position that all extremes of weather are due to man. They blamed the serious spring flooding and tornadoes in the Midwest on global warming even though they were caused by a cooling Earth, a return to a cold Pacific and a strong La Nina.
The National Wildlife Federation’s Amanda Staudt noted in a press release: “Warmer air can carry more water, and this means more heavy precipitation in the central United States. Big Midwestern storms that used to be seen every 20 years or so will likely occur every four to six years by century’s end.” But Dr. Roger Pielke Sr. of the University of Colorado responded in his Climate Science blog, Staudt presents no evidence that this flood event was due to warmer air and an increase in atmospheric water vapor, which has not increased over North America. She also ignored evidence that flood losses are actually decreasing in the United States.
Also, it was not warm. In fact, it was unusually cold. The last winter and spring period ranked as the 25th coldest out of 113 years for the north central states. The cold air suppressed the jet stream and storm track, resulting in heavy snows, spring floods and severe weather. And though the 119 tornado deaths so far this year are tragic, they fall far short of more than 300 deaths recorded in 1965 and 1974, and the over 800 who died in 1927. Indur Glokany, an IPCC reviewer, reported that global mortality rates due to extreme weather have declined by 95 percent since the 1920s.
Despite the evidence, don’t expect alarmists to concede anything on this issue anytime soon. They have too much of a vested interest in having you believe what they say is true. So expect them to blame any unusual weather on man-made climate change. As Greenpeace’s Steven Guilbeault’s admonished the media “Global warming can mean colder; it can mean drier; it can mean wetter; that’s what we’re dealing with.” See the Examiner online version here. See the version with hyperlinks here. See the prior day’s story from the NWF stating that the extremes were due to global warming here.
Aug 01, 2008
Al Gore’s Carbon Empire: Cashing in on Climate Change
By Fred Lucas, Capital Research Foundation Watch
Al Gore says everyone will benefit when new government rules require companies to pay to reduce global warming. But some people will benefit more than others, as will some companies. Benefiting most are those like the ex-vice president who can set up and invest in companies that will profit from the federal regulations imposing heavy costs on others.
Who pays for Gore’s crusade? In accounting for the $300 million in costs for the public education campaign of the Alliance for Climate Protection, the group’s website says that Al Gore pays for much of the project himself using the proceeds from his film and book, An Inconvenient Truth, and the $750,000 cash prize attached to the Nobel Peace Prize. It adds that he “has since received additional support in the form of private donations from those concerned about solving the climate crisis.”
Andrew C. Revkin of the New York Times reported on the newspaper’s Dot Earth blog March 31 that the Alliance raised half the sum - $150 million - for the ad campaign. But from whom? Gore says he put up about $3 million, but when asked the question on TV’s “60 Minutes,” he would not identify other funders. Solar and wind power companies? Hedge funds and venture capitalists? Gore’s own company, Generation Investment Management?
Gore and the global warming crowd are usually quick to challenge the credibility and sincerity of any scientist, climatologist or policy organization skeptical of man-made global warming. They call skeptics “shills” for Big Oil or, worse, “deniers,” invoking the term used against anti-Semites who deny the Holocaust. But they refuse to acknowledge their own growing financial interest in the carbon control industry. Barack Obama has said if he is elected president, he will be sure to find a prominent role for Al Gore in his administration. If that happens, will anyone raise questions about Al Gore’s conflict of interest?
Since leaving public office, Al Gore has become a one-man conglomerate: He writes books, stars in a movie, commands massive speaking fees, and sits on numerous corporate boards. According to Bloomberg News, Gore had less than $2 million when he left the vice presidency in 2001. Today his fortune is more than $100 million (Fast Company, July 2007) and the prospects are that he will grow even richer mounting his crusade against global warming.
The prospect of carbon regulation is why major corporations have latched onto Gore. He is the environmental movement’s bullhorn to the world, proclaiming the crisis of planetary warming. But the truth is that Gore also has become a bullhorn for corporations that are ready to cash in on the hysteria.
Read much more here.
Fred Lucas is a senior writer and investigative reporter for Cybercast News Service
Jul 31, 2008
Hansen Update
By Steve McIntyre, Climate Audit
No single topic seems to arouse as much blog animosity as any discussion of Hansen’s 1988 projections. Although NASA employees are not permitted to do private work for their bosses off-hours (a currying favor prohibition, I suppose) - for example, secretaries are not supposed to do typing, over at realclimate, Gavin Schmidt, in his “private time”, which flexibly includes 9 to 5, has provided bulldog services on behalf of his boss, James Hansen, on a number of occasions.
In January 2008, I discussed here and here how Hansen’s projections (from 1988) compared against the most recent RSS and MSU data, noting a downtick which resulted in a spread not merely between observations and Scenario A, but between observations and Scenario B, sometimes said to have been vindicated.
However, rather than engaging in further exegesis of the January versions, I thought it would be useful to update the graphics to include satellite data up to June 2008 and GISS data up to May 2008. Ironically, the new data has resulted in a downtick that is more substantial than either of the versions published in January. I’ve re-centered RSS to match GISS GLB on 1979-1997.
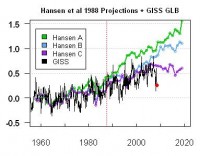
See larger image here.
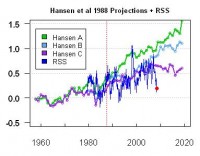
See larger image here.
Read full blog including NASA’s Gavin Schmidt’s own plot and reader comments here.
Icecap Note: Hansen Scenario C supposes that CO2 are stabilized at 368 ppm in 2000 - a level already surpassed. Yet temperatures from GISS and RSS are trending lower than even Scenario C. We will see if that continues.
|

