May 01, 2008
More Carbon Dioxide, Please: Raising a Scientific Question.
By Roy Spencer in National Review Online
There seems to be an unwritten assumption among environmentalists - and among the media - that any influence humans have on nature is, by definition, bad. I even see it in scientific papers written by climate researchers. For instance, if we can measure some minute amount of a trace gas in the atmosphere at the South Pole, well removed from its human source, we are astonished at the far-reaching effects of mankind’s “pollution.”
But if nature was left undisturbed, would it be any happier and more peaceful? Would the carnivores stop eating those poor, defenseless herbivores, as well as each other? Would fish and other kinds of sea life stop infringing on the rights of others by feasting on them? Would there be no more droughts, hurricanes, floods, heat waves, tornadoes, or glaciers flowing toward the sea?
In the case of global warming, the alleged culprit - carbon dioxide - just happens to be necessary for life on Earth. How can Al Gore say with a straight face that we are treating the atmosphere like an “open sewer” by dumping carbon dioxide into it? Would he say the same thing if we were dumping more oxygen into the atmosphere? Or more nitrogen?
As a climate researcher, I am increasingly convinced that most of our recent global warming has been natural, not manmade. If true, this would mean that global temperatures can be expected to peak in the coming years (if they haven’t already), and global cooling will eventually ensue. Just for the sake of argument, let us assume that manmade global warming really is a false alarm. In that case, we would still need to ask: What are the other negative effects of pumping more CO2 into the atmosphere? Read what they are and why they may not be problems here.
May 01, 2008
La Nina and Pacific Decadal Oscillation Cool the Pacific
NASA Earth Observatory
A cool-water anomaly known as La Nina occupied the tropical Pacific Ocean throughout 2007 and early 2008. In April 2008, scientists at NASA’s Jet Propulsion Laboratory announced that while the La Nina was weakening, the Pacific Decadal Oscillation-a larger-scale, slower-cycling ocean pattern-had shifted to its cool phase.
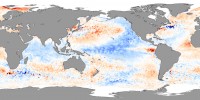
This image shows the sea surface temperature anomaly in the Pacific Ocean from April 14-21, 2008. The anomaly compares the recent temperatures measured by the Advanced Microwave Scanning Radiometer for EOS (AMSR-E) on NASA’s Aqua satellite with an average of data collected by the NOAA Pathfinder satellites from 1985-1997. Places where the Pacific was cooler than normal are blue, places where temperatures were average are white, and places where the ocean was warmer than normal are red.
The cool water anomaly in the center of the image shows the lingering effect of the year-old La Nina. However, the much broader area of cooler-than-average water off the coast of North America from Alaska (top center) to the equator is a classic feature of the cool phase of the Pacific Decadal Oscillation (PDO). The cool waters wrap in a horseshoe shape around a core of warmer-than-average water. (In the warm phase, the pattern is reversed).
Unlike El Nino and La Nina, which may occur every 3 to 7 years and last from 6 to 18 months, the PDO can remain in the same phase for 20 to 30 years. The shift in the PDO can have significant implications for global climate, affecting Pacific and Atlantic hurricane activity, droughts and flooding around the Pacific basin, the productivity of marine ecosystems, and global land temperature patterns. “This multi-year Pacific Decadal Oscillation ‘cool’ trend can intensify La Nina or diminish El Nino impacts around the Pacific basin,” said Bill Patzert, an oceanographer and climatologist at NASA’s Jet Propulsion Laboratory, Pasadena, Calif. “The persistence of this large-scale pattern [in 2008] tells us there is much more than an isolated La Nina occurring in the Pacific Ocean.”
Icecap Note: We have been noting this shift in the Pacific as has Bill for a while. As he says it favors more of these cool La Ninas, more tornadoes, hurricanes, winter snow, spring flooding and summer heat waves and drought - and importantly a cooling of the global temperatures, which will be augmented if cycle 24 proves to be quiet and when the AMO cycles back into its cool mode. ALSO see Dr. Don Easterbrook’s take on what this means here.
Apr 30, 2008
The Evidence Against Human Causation in Global Warming
Chris Towsey, MSc(Syd) BSc (Hons) Dip Ed FAusIMM
The following data does not fit the assumption that human activities result in global warming. It follows then that the assumption that anthropogenic CO2 causes global warming is fundamentally flawed.
· Ice core data shows that there have been repeated heating and cooling events on the earth long before human activity was significant. Global warming is a
naturally occurring event. Attempting to interfere in this process may have unpredictable consequences
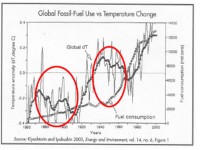
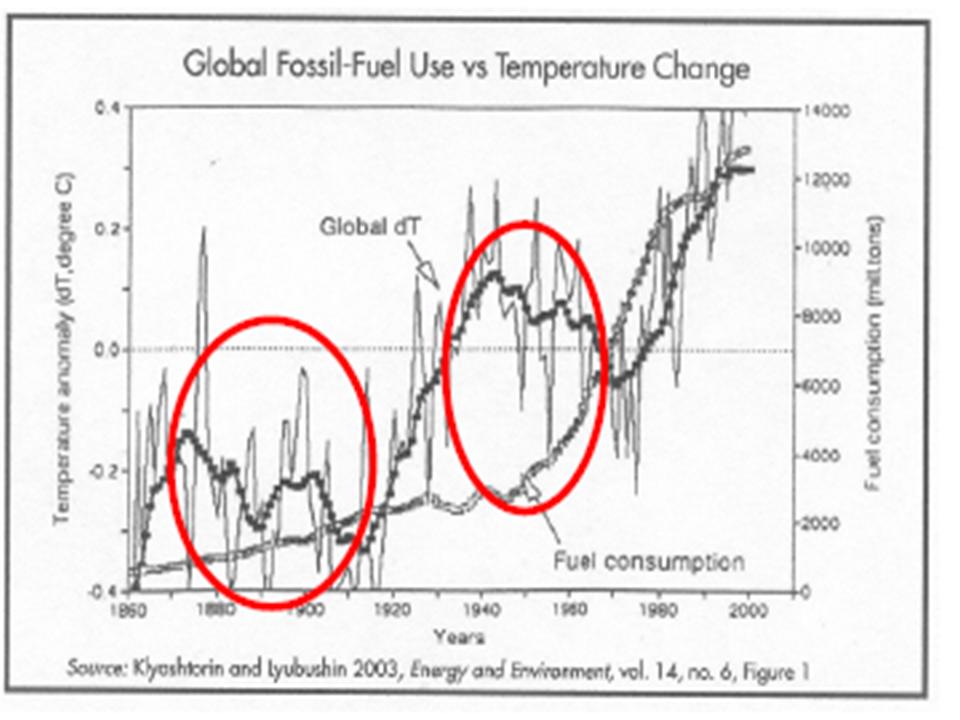
· The Earth cooled between 1940 and 1975 while fossil fuel consumption rose dramatically. The Earth should have warmed if CO2 emissions from fossil fuel
consumption is a cause of global warming. The theory does not fit the data.
· Ignoring data that does not fit a theory is poor science. Only one inconsistent piece of data is necessary to negate a theory.
· Reducing CO2 emissions and introducing carbon trading will not prevent global warming, but will make energy dramatically more expensive to the consumer.
The evidence does not support the commonly held view that human activities that produce increased levels of CO2, is a cause of global warming.
Global warming is a naturally occurring and recurring event unrelated to human activity. Cutting CO2 emissions therefore will not alter global warming. Trading carbon credits will have no effect on global warming. It would be more useful to study the period from 1940 to 1975, when the Earth cooled hile fossil fuel consumption skyrocketed, to find out why the Earth cooled. This period holds the key to the root cause of global warming.
See full size image here
Read more here.
Apr 27, 2008
An Urgent Signal for a Coming Ice Age
By Peter Harris
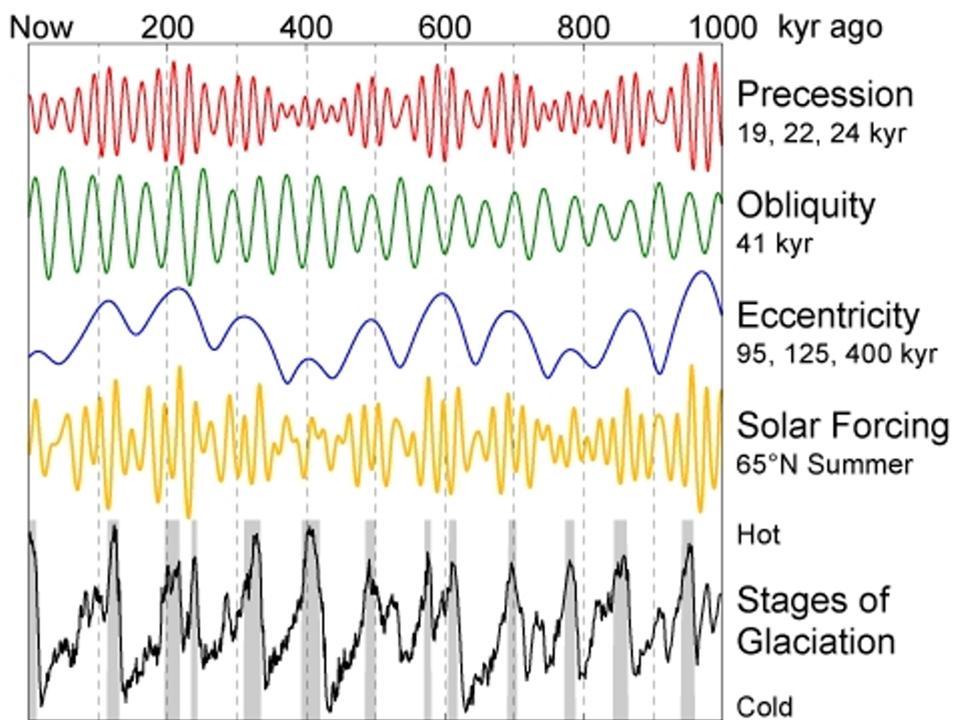
When paleoclimatologists met in 1972 to discuss how and when the present warm climate would end , termination of this warm climate we call the Holocene seemed imminent and it was expected that rapid cooling would lead to the coming ice age. These ideas were based on the 1M year analogue for climate transitions first proposed by Milankovitch over 60 years ago, which has been demonstrated to show the correlation of glacial and interglacial climate with solar insolation as it is modulated by our changing distance from the sun. These data sets may be used to serve as a signal for the coming ice age. Orbital geometry was approaching similar conditions to those of the previous transitions to ice.
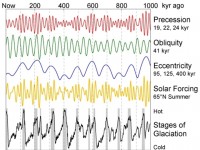
But soon it was observed that global temperature was increasing and at about this time Global Climate Modeling GCM received more attention and the Milankovitch analogue was forgotten. There has been no further discussion about the coming ice age. The data below was compiled by the mathematicians Quinn, Levine et al in 1991 and Insolation values due to Precession, Obliquity and Eccentricity as well as total insolation or Solar Forcing are charted on the same time scale as Stages of Glaciation representing climate. This climate data was provided by Lisieckie and Raymo and is based on sediment proxies. The climate data shows close agreement with ice core data based on a different proxy. Produced in 1991 this chart confirms the correlation of climate transitions with insolation which is modulated by Earth position in orbit and was first proposed by Milankovitch over 60 years ago.
See full size graph here
In studying the analogue there is no use of a GCM which is subject to limitations and interpretation. Use of the analogue is based on simple observation of clear empirical data and the archeological record of temperature. The data and the correlation are sound. The geological record shows that the transitions are sudden, long term and extreme. All of the Milankovitch parameters for a transition are satisfied by the present orbital position. We have already seen extreme winter conditions and T appears to be declining in the short term. The decline will continue under rapidly declining insolation and the coincident effect of reduced solar activity which has also been correlated with temperature in the past. Read full opinion piece here.
Peter Harris is a retired Queensland Engineer
Apr 26, 2008
Late Spring Snows in the North Central
Stories in the Star Tribune and on KSFY.com
It’s late April, but Old Man Winter is showing that he isn’t finished with Minnesota just yet. A snowstorm has dumped snow across much of western and northern Minnesota - with some reports of a foot or more. The National Weather Service has received reports of an estimated 18 inches of snow in Pelican Rapids, 15 inches in Hawley and 13.5 inches in Wilkin. Other snowfall reports include 12 inches in Donnelly, more than 10 inches in Hewitt and 9.5 inches north of Park Rapids. It also snowed in the Twin Cities but not as much. Read more here. See video on what some clever Minnesotans think of this global warming here .
Also as Drew Sandholm on KSFY.com reported “Snow, snow, and more snow.” That’s what Brookings saw Friday. A lot of blowing snow, cars in the ditch, and semi after semi pulled over. Truckers like Harold Schachel are slowed down by the falling snow.
“Welcome to the great north area of the United States,” said Schachel. He was waiting on a load to take back to Wisconsin, but this snow was quickly stopping traffic. The snow fell so fast it caused low visibility, so the Highway Patrol closed Interstate-29 from Brookings all the way up to the North Dakota border.

See more here. See video here.
|

