On Wednesday, a short item in the Federal Register underscored the regressive nature of the “everything” effort that is being promoted by some of America’s highest-profile environmental groups, climate-change activists, politicians, and academics. The item, published by the Office of Energy Efficiency and Renewable Energy at the Department of Energy, forecasts the “representative average unit costs of five residential energy sources for the year 2021.”
The forecast shows that on an energy-equivalent basis, electricity will cost about $39 per million Btu. It also projects that one million Btu in the form of natural gas will cost about $11, propane will cost about $19, No. 2 heating oil will cost $20, and kerosene will cost $23. Thus, electricity will cost nearly four times as much as natural gas and twice as much as propane, a fuel that is commonly used by rural Americans in their homes, and on their farms and ranches.
The electrify everything push will impose regressive energy taxes on low-income consumers.
As I wrote in these pages last month during the deadly blizzard that paralyzed Texas for almost a week, there are a myriad of problems with attempting to electrify all of our transportation, industrial and residential energy systems. I wrote, “attempting to electrify everything would be the opposite of anti-fragile. Rather than make our networks and critical systems more resilient and less vulnerable to disruptions caused by extreme weather, bad actors, falling trees, or simple negligence, electrifying everything would concentrate our dependence on a single network, the electric grid, and in doing so make nearly every aspect of our society prone to catastrophic failure if - or rather, when - a widespread or extended blackout occurs.”
Indeed, the risks to our energy security, resilience, and reliability are obvious. But the bigger, and more immediate issue is the regressive nature of forcing consumers to use electricity instead of energy sources like natural gas and propane that sell for a quarter, or half, as much as the energy that consumers can get from the electric grid.
Last year, I published a report for the Foundation for Research on Equal Opportunity that looked at the natural gas bans that are being implemented in dozens of communities in California. According to the Sierra Club, 42 California communities have now imposed bans. On its website, the club, which is the largest environmental group in America, claims that gas-free homes are “a win for our climate, health, and safety.” In January, the city of Denver released a plan that aims to ban natural gas connections in new buildings by 2027. In February, the city of Seattle enacted legislation that bans the use of natural gas in new commercial buildings and large multifamily buildings. In Massachusetts, about a dozen towns have partnered with the Rocky Mountain Institute, which recently got a $10 million grant from the Bezos Earth Fund, to advocate for the right to ban the use of natural gas in homes and commercial buildings.
Banning natural gas forces consumers to use more-expensive electricity to heat their homes, cook their food, and heat the water needed to wash their clothes and dishes. Proponents of the electrify everything push, including the Natural Resources Defense Council, which got $100 million from the Bezos Earth Fund, prefer to call their efforts “beneficial electrification.” The more accurate term is “forced electrification” because it will increase the energy burden on low- and middle-income consumers.
Increasing the energy burden in states like California, which has one of the highest poverty rates in the country, is indefensible. When accounting for the cost of living, 18.1% of the state’s residents are living in poverty. Forcing poverty-stricken Californians to use electricity instead of lower-cost natural gas will increase the energy burden and worsen poverty.
Despite these facts, bans on natural gas are being cheered by some of America’s highest-profile climate activists. In January, Bill McKibben, the founder of 350.org published an article in the New Yorker in which he said if there is a “basic rule of thumb for dealing with the climate crisis, it would be: stop burning things” including natural gas. McKibben says we should shift our energy needs to solar and wind energy. Also in January, Mayor Bill de Blasio declared that New York City will “renounce fossil fuels fully” and “ban fossil fuel connections in the city by the end of this decade.”
In March, Peter Iwanowicz, executive director of Environmental Advocates of New York, declared that policymakers should stop looking at the use of alternative fuels like renewable natural gas because they “distract from the basic task of getting New Yorkers to stop burning things.”
I am pro-electricity. But the idea that we humans should “stop burning things” in the name of climate change ignores the need for energy security, resilience, and basic fairness. Over the past five years, I traveled to India, Iceland, Lebanon, Puerto Rico, Colorado, and New York to look at the world through the lens of electricity. I’ve recently published a book (A Question of Power: Electricity and the Wealth of Nations) and co-produced (with my colleague, Tyson Culver) a documentary (Juice: How Electricity Explains the World) that spotlights electricity. The book and film show that we need many terawatts of new generation capacity to bring the 3 billion people in the world who are now living in energy poverty out of the dark and into the bright lights of modernity.
In short, the people of the world need more electricity. Lots more. But the Texas Blackouts proved that we need diverse and resilient energy networks that can deliver huge quantities of energy during extreme weather events. Attempting to electrify everything is a recipe for increased inequality and decreased energy security and resilience.
Follow me on Twitter or LinkedIn. Check out my website or some of my other work here.
Robert Bryce is the host of the Power Hungry Podcast. An author and journalist, Bryce has been writing about energy, politics, and the environment for more than 30 years.
Does President Joe Biden really want the United States to cede its hard-won energy independence and leadership position in the world? Because that is precisely what will happen if the president tries to sweep away the inexpensive, reliable forms of energy that have been powering America for decades.
To understand the disaster that awaits the nation if Biden makes good on his pledge to replace fossil fuels with wind and solar power, we need only look to California and Texas, two states that have already tried to do exactly that.
Power outages are now commonplace in California. Its troubles are explained by officials who now admit to an over-reliance on wind and solar power. Even the Los Angeles Times reported:
...gas-burning power plants that can fire up when the sun isn’t shining or the wind isn’t blowing have been shutting down in recent years, and California has largely failed to replace them ...
Consequently, the state has fallen thousands of megawatts behind its needs. Governor Gavin Newsom admitted, “we failed to predict and plan for these shortages” and took responsibility for the rolling blackouts. Of course, he wants everyone to conserve while they look for new sources of energy. And that energy will have to be supplied by fossil fuel from neighboring states. This, as California continues its misguided intent to transition to 60% renewable energy by 2030 and 100% “climate-friendly energy” by 2045 (which is required by state law). And note, Biden has gone even further and committed to making the nation 100% renewable within 15 years.
And what about Texas, where an over-reliance on wind and solar power was clearly a major reason that millions of Texans shivered in the dark for several days in late February?
In a desperate attempt to support these politically-correct but expensive and unreliable energy sources, major media outlets and left-leaning legislators are trying to convince the public that wind and solar power problems were not a significant factor in the Texas blackout.
On March 3, Rep. Ro Khanna, a California Democrat who chairs the subcommittee on Environment of the Committee on Oversight and Reform in the U.S. House of Representatives, which is investigating the Texas blackout, sent a letter to the Electric Reliability Council of Texas in which he wrote:
Despite false claims from Texas officials that the power outages were attributable to renewable sources like wind turbines, the vast majority of the dip in electricity supply came from fossil fuel generation. Renewable sources of energy only make up roughly 10% of power in Texas, while over half of the energy comes from fossil fuels such as power plants fired by natural gas.
In “No, frozen wind turbines aren’t the main culprit for Texas’ power outages,” the February 16 article in Austin’s Texas Tribune, Heather Zichal, CEO of the industry group the American Clean Power Association, complained that opponents of renewable energy were “engaging in a politically opportunistic charade” “to distract from the failures” elsewhere in the system and slow the “transition to a clean energy future.”
‘It is just a lie that wind turbines, ‘green energy’ are the root causes of the problems in Texas right now,” said MSNBC host Chris Hayes on February 16.
And, of course, the Los Angeles Times attacked those who blamed the blackout on an over-reliance on renewables, implying that the Texas deep freeze was caused by, you guessed it, climate change.
The Times were right in one sense: the impossible effort to ‘stop climate change’ did contribute the blackout. Mark Mathis, president of Clear Energy Alliance, explained,
[M]any of natural gas lines froze because ERCOT cut off electricity to those lines, something a report on the 2011 Texas blackout advised them to be careful not to do in any future deep freeze. Why were the pipelines not powered by natural gas? FERC required them to switch from direct gas power to electricity because that was supposed to reduce greenhouse emissions. Natural gas did provide a lot more power when it was needed. It just couldn’t provide enough.
The really big problem was a lack of reserve margin. Texas has a cushion of about 7.5 to 8.5 percent. That’s half of what most electricity markets provide. With so much power coming from unreliable electricity sources the reserve margin should be at least 20 percent, some say even more.
Dr. Sterling Burnett, senior fellow of the Illinois-based Heartland Institute, showed that Rep. Khanna’s statement that “the vast majority of the dip in electricity supply [during the blackout] came from fossil fuel generation” is highly deceptive. In ”Wind and Solar Power Fail When You Need Them the Most, “ he explained that there was practically nothing coming from wind and solar in the days before the cold snap. Burnett wrote:
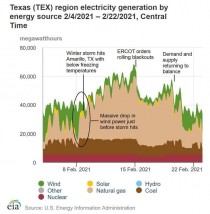
Data from the Electric Reliability Council of Texas shows four days before the first snowflake fell, wind and solar were providing 58 percent of the electric power used in Texas. Fortuitously, the sun had been shining and the wind blowing. These conditions ended, and within a matter of hours more than 13,000 megawatts of wind and solar power went offline. The wind died off and the turbines began to freeze, and winter storm clouds blocked the sun.
As always, natural gas, coal, and nuclear facilities ramped up production when wind and solar failed. Then the storm hit. Even as the wind picked up, ice had formed on the turbines, keeping them offline, and snow and ice coated solar panels, preventing them from generating power. More wind and solar failed, and the cold had a cascading effect on coal, natural gas, and nuclear. Some gas lines froze, other gas, due to contracts, was being shipped out of state, some equipment failed, and some powerlines snapped and transformers broke. More coal, natural gas, and nuclear failed during the storm than wind and solar, but only because wind and solar had failed even before the storm hit. What power remained during the crisis was delivered almost entirely by natural gas, coal, and nuclear. Wind and solar power remained almost wholly offline for the duration.
The following plot from the Energy Information Administration shows this clearly:
The result was inevitable: over eight million Texans (including Burnett), in more than four million homes, lost lights, power, and heat.
At first glance, it appears that gaining useful energy from the sun and the wind should be possible and relatively inexpensive. After all, we have long used the wind to sail boats and grind grain and the sun to heat a multitude of things. Producing electricity from an intermittent source of power is, however, an entirely different matter.
Most people are unaware that the supply of electricity to an electric grid must equal the demand at all times. At any point when this is not the case, the grid will collapse and we have a blackout, such as in Texas. It is not possible for the supply to almost meet demand; it is all or nothing.
On a large electric grid such as that in Texas, the lack of a small amount of solar or wind power can and will and did cause the grid to crash. If all the available supply of natural gas, coal, or nuclear power is at maximum availability but only one percent or less of the online supply of wind and solar becomes unavailable when the wind is not blowing or the turbine is iced up and the sun is not shining or the solar panels are covered with snow, the grid will and did crash.
Mathis stated:
Unreliable wind and solar are destabilizing our electric grid. When power drops quickly as it often does with wind/solar, it must be replaced by natural gas in an instant. Too much wind/solar on the grid makes this challenge unreasonably difficult.
It is amusing that a shortage of natural gas is also being blamed, though well it should. Amusing, because the government has been shutting down gas pipelines, but more amusing yet because of the electric energy rule of thumb coined by Terigi Ciccone and this article’s co-author, Jay Lehr. The rule says:
All solar and wind power on an electric grid must be backed up with an equal or greater amount of fossil fuel power (normally natural gas) on standby 100% of the time ready to go online in seconds.
There are those who think that, eventually, wind and solar power can be successfully backed up by batteries. But, as Dr. David Wojick explained in this podcast, it is clearly not possible now, nor will it be at any time in the foreseeable future.
To defeat wind and solar power, we cannot rely simply on informing the public and policymakers about their extraordinary cost and unreliability. We must also critique the root cause of a huge push for these power sources, namely the nonsensical belief that we can control future climate if we transition away from fossil fuels to wind and solar power.
Besides uninformed environmental extremists and anti-Western activists, the push to transition our energy infrastructure has several powerful backers:
The government supports it because they know it will require government rationing as a result of the necessary shortfall in supply. What government does not want more power over its subjects?
The electric energy utilities are also supportive since they get to build more into their systems, charge more for their energy and make a fortune in spare parts and excessive prices when things go badly. How about a $9,000 charge for a kilowatt hour in Texas last month?
Those who build wind and solar installations reap huge financial rewards from the government subsidies that make them economical. The March 15 video from Clear Energy Alliance explains how truly massive these subsidies are:
Texas Gov. Greg Abbott told Fox News host Sean Hannity that the Texas blackout “Shows how the Green New Deal would be a deadly deal for the United States of America.” Even in Montana, where only 900 people lost power for 30 minutes, Rep. Matt Rosendale wrote that the rolling blackouts “demonstrate the dangerous consequences of transitioning away from reliable fossil fuel-based power sources.”
They are completely right of course. Mathis concluded:
More blackouts are coming. Energy IS national security. Every dominant nation must also be dominant in energy, or it isn’t a dominant power.
And this is exactly where Biden is taking America.
----------------
Tom Harris is Executive Director of the Ottawa, Canada-based International Climate Science Coalition (ICSC) and a policy Advisor to The Heartland Institute. Dr. Jay Lehr is Senior Policy Analyst with ICSC and former Science Director of The Heartland Institute.
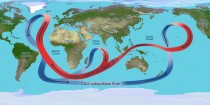
Illustration depicting the overturning circulation of the global ocean.Illustration depicting the overturning circulation of the global ocean. Throughout the Atlantic Ocean, the circulation carries warm waters (red arrows) northward near the surface and cold deep waters (blue arrows) southward. Image credit: NASA/JPL
PASADENA, Calif. - New NASA measurements of the Atlantic Meridional Overturning Circulation, part of the global ocean conveyor belt that helps regulate climate around the North Atlantic, show no significant slowing over the past 15 years. The data suggest the circulation may have even sped up slightly in the recent past.
The findings are the result of a new monitoring technique, developed by oceanographer Josh Willis of NASA’s Jet Propulsion Laboratory in Pasadena, Calif., using measurements from ocean-observing satellites and profiling floats. The findings are reported in the March 25 issue of Geophysical Research Letters.
The Atlantic overturning circulation is a system of currents, including the Gulf Stream, that bring warm surface waters from the tropics northward into the North Atlantic. There, in the seas surrounding Greenland, the water cools, sinks to great depths and changes direction. What was once warm surface water heading north turns into cold deep water going south. This overturning is one part of the vast conveyor belt of ocean currents that move heat around the globe.
Without the heat carried by this circulation system, the climate around the North Atlantic—in Europe, North America and North Africa—would likely be much colder. Scientists hypothesize that rapid cooling 12,000 years ago at the end of the last ice age was triggered when freshwater from melting glaciers altered the ocean’s salinity and slowed the overturning rate. That reduced the amount of heat carried northward as a result.
Until recently, the only direct measurements of the circulation’s strength have been from ship-based surveys and a set of moorings anchored to the ocean floor in the mid-latitudes. Willis’ new technique is based on data from NASA satellite altimeters, which measure changes in the height of the sea surface, as well as data from Argo profiling floats. The international Argo array, supported in part by the National Oceanic and Atmospheric Administration, includes approximately 3,000 robotic floats that measure temperature, salinity and velocity across the world’s ocean.
With this new technique, Willis was able to calculate changes in the northward-flowing part of the circulation at about 41 degrees latitude, roughly between New York and northern Portugal. Combining satellite and float measurements, he found no change in the strength of the circulation overturning from 2002 to 2009. Looking further back with satellite altimeter data alone before the float data were available, Willis found evidence that the circulation had sped up about 20 percent from 1993 to 2009. This is the longest direct record of variability in the Atlantic overturning to date and the only one at high latitudes.
The latest climate models predict the overturning circulation will slow down as greenhouse gases warm the planet and melting ice adds freshwater to the ocean. “Warm, freshwater is lighter and sinks less readily than cold, salty water,” Willis explained.
For now, however, there are no signs of a slowdown in the circulation. “The changes we’re seeing in overturning strength are probably part of a natural cycle,” said Willis. “The slight increase in overturning since 1993 coincides with a decades-long natural pattern of Atlantic heating and cooling.”
If or when the overturning circulation slows, the results are unlikely to be dramatic. “No one is predicting another ice age as a result of changes in the Atlantic overturning,” said Willis. “Even if the overturning was the Godzilla of climate 12,000 years ago, the climate was much colder then. Models of today’s warmer conditions suggest that a slowdown would have a much smaller impact now.
“But the Atlantic overturning circulation is still an important player in today’s climate,” Willis added. “Some have suggested cyclic changes in the overturning may be warming and cooling the whole North Atlantic over the course of several decades and affecting rainfall patterns across the United States and Africa, and even the number of hurricanes in the Atlantic.”
With their ability to observe the Atlantic overturning at high latitudes, Willis said, satellite altimeters and the Argo array are an important complement to the mooring and ship-based measurements currently being used to monitor the overturning at lower latitudes. “Nobody imagined that this large-scale circulation could be captured by these global observing systems,” said Willis. “Their amazing precision allows us to detect subtle changes in the ocean that could have big impacts on climate.”
For more information about NASA and agency programs, visit NASA
JPL is managed for NASA by the California Institute of Technology in Pasadena.
See GWPF’s coverage of the Science News story on “New findings from an international ocean observing network are calling into question the longstanding idea that global warming might slow down a big chunk of the ocean’s “conveyor belt.”
The massive blast of Siberia-like cold that is wreaking havoc across North America is proving that if we humans want to keep surviving frigid winters, we are going to have to keep burning natural gas - and lots of it - for decades to come.
That cold reality contradicts the “electrify everything” scenario that’s being promoted by climate change activists, politicians, and academics. They claim that to avert the possibility of catastrophic climate change, we must stop burning hydrocarbons and convert all of our transportation, residential, commercial, and industrial systems so that they are powered solely on electricity, with most of that juice coming, of course, from forests of wind turbines and oceans of solar panels.
But attempting to electrify everything would concentrate our energy risks on an electricity grid that is already breaking under the surge in demand caused by the crazy cold weather. Across America, countless people don’t have electricity. I’m one of them. Our power here in central Austin went out at about 3 am. I am writing this under a blanket, have multiple layers of clothes on, and am nervously watching my laptop’s battery indicator.
Texas Outages Put Reliability Of Renewable Energy In The Spotlight
This blizzard proves that during extreme weather winter, solar panels and wind turbines are of little or no value to the electric grid.
This blizzard proves that our natural gas grid is part of our critical infrastructure and that we shut it down at our peril. The natural gas network is essential because it can deliver big surges in energy supplies during periods of peak demand. In January 2019, U.S. natural gas demand set a record of 145 billion cubic feet per day. That record will be smashed during this blizzard, and daily volumes will exceed 150 Bcf. That is an enormous amount of energy. In fact, on the coldest days of winter, the amount of energy delivered by the gas grid is roughly three times as great as the energy consumed during the hottest days of the summer.
During peak cold events like this one, the gas grid delivers about 80 Bcf/d to homes and businesses. In energy equivalent terms, that’s roughly 83 trillion Btu, or the energy output of about 1 terawatt of electric generation capacity for 24 hours. Put another way, to equal the 80 Bcf/d of gas delivered during cold snaps, the U.S. would need an electric grid as large as all existing generation in the country, which is currently about 1.2 terawatts.
Thanks to excellent geology, a century of gas production, and a fully developed transmission and distribution grid, the domestic natural gas sector can deliver surges of the fuel that are, in fact, lifesaving. That is due, in large part, to the fact that we can store vast amounts of gas and only tiny quantities of electricity. In short, our electric grid simply cannot deliver the massive amounts of energy needed during the winter to keep us from freezing to death. That means we need to keep burning natural gas. If you prefer to rely on batteries, be my guest.
It’s essential to note that the blizzard and blackouts that are paralyzing the country are occurring at roughly the same time that some of America’s most famous activists and politicians are saying we should quit using all hydrocarbons and dozens of cities across the country are imposing bans on the use of natural gas.
On January 22, Bill McKibben, the founder of 350.org and arguably America’s most famous environmentalist, published an article in the New Yorker in which he said if there is a “basic rule of thumb for dealing with the climate crisis, it would be: stop burning things” including natural gas. McKibben says we should shift our energy needs to solar and wind energy.
Six days later, on January 28, in his state of the city address, Mayor Bill de Blasio declared that New York City will “renounce fossil fuels fully” and “ban fossil fuel connections in the city by the end of this decade, literally ensuring that our only choice is renewable energy.”
As I showed in a report last year for the Foundation for Research on Equal Opportunity, dozens of communities in California have banned or restricted the use of natural gas. According to the Sierra Club, 42 California communities have now imposed bans. So has the city of Seattle. In Massachusetts, about a dozen towns have partnered with the Rocky Mountain Institute, which recently got a $10 million grant from the Bezos Earth Fund, to advocate for the right to ban the use of natural gas in homes and commercial buildings.
In addition to being bad for energy security, these bans are a form of regressive tax on the poor and the middle class because they compel consumers to use electricity, which costs four times more than natural gas on an energy equivalent basis. Despite these very cold facts, it is certain that the efforts to ban natural gas and electrify everything will continue.
I am pro-electricity and electrification. Over the past year, I’ve published a book (A Question of Power: Electricity and the Wealth of Nations) and co-produced a documentary (Juice: How Electricity Explains the World) that spotlights electricity and why we need many terawatts of new generation capacity to bring the 3 billion people in the world who are now living in energy poverty out of the dark and into the bright lights of modernity. But more than being pro-electricity, I am pro-human. The ongoing blizzard is proving our vulnerability to extreme weather events and it is showing that we can’t rely on electricity alone.
Events like the September 11 attacks, Superstorm Sandy, and the coronavirus proved that we need to must make our society more resilient to threats of all kinds. A robust natural gas grid helps our resilience. Electrifying everything will do the opposite.
Robert Bryce
Robert Bryce is the host of the Power Hungry Podcast. An author and journalist, Bryce has been writing about energy, politics, and the environment for more than 30 year.
The oceans of the world contain vast quantities of heat. Most of that heat is contained in the upper reaches of the ocean which average 2 miles in depth. In fact, between 30 degrees north of the equator and 30 degrees south of the equator the upper 1000 feet of the ocean contain about 1,000 times more heat energy than the atmosphere!
Due to this extraordinary imbalance, changes in ocean temperature can have a significant impact on atmospheric wind and thermal variations. It is important to remember that the atmosphere of earth is not in balance and it never has been. It is always out of alignment, constantly seeking to find an alignment that will strike a balance between the cold of the polar regions and the heat of the tropics. It will never happen. Forever searching but never finding.
As a result of this never ending battle to find a balance between the cold and the hot, we have weather. The “job” of the weather is to mix the cold and the hot together in an attempt to find atmosphere peace and tranquility. That will never happen either! Constantly searching, always looking but never finding, the atmospheric wars wage on for days, weeks, months, years, centuries, forever.
At times the forces of cold and hot bottle up, bulging at the seams, ready to explode. That’s when the weather machine revs up to another gear. The cold bursts from the arctic, the hot gushes northward, great differences in air pressure and the spinning of the earth whip up gigantic cyclones producing blinding snows, torrential rains, hurricane force winds, floods, tornadoes, frozen pipes and bad air days! And then it’s over. The great expenditure of pent up fury have done their job. The opposing forces shake hands. The sun comes out, the wind is gone and the snow and rain have ended and all that’s left is the cleanup.
Two hundred years ago there was much less to cleanup after the storm than now. The storms were just as severe, just as frequent but we had much less to break. What the storms did break was the food chain. Famine was the ultimate cost paid by the living in those days. A great prosperity has emerged in the last 200 years. Starting with the innovations of the industrial revolution, we now live twice as long as then. We enjoy something that was unknown to most 200 years ago, leisure time and a lifestyle unimaginable to those that lived in the early 19th century.
But with our advancement has come a vulnerability. Even though we now, for the first time in human history have a fighting chance against the atmosphere war machine, we are, in a very real way more vulnerable to the destruction caused by storms than in the simpler times of the past. There’s a lot more to break now than in the past.
There is always a price to pay for anything, and there should be. Our increased vulnerability to weather in some aspects of civilization is just one of those bills we have to pay, like it or not. I for one am willing to pay that bill. There’s nothing like a warm place to live with food on the table and a good internet connection when the snow is falling, the wind is howling and the temperature is plunging, just ask those folks in Texas and the other southern states that felt the wrath of nature’s imbalance this month. Perhaps there is a lesson to be learned from their collective suffering and it might be, If it works, don’t fix it.


