

By Joseph D’Aleo
In Central Park Temperature - Three Radically Different Us Government Versions on Icecap in 2008 here, we noted some significant differences between the various NOAA versions for the stations.
The raw observations are taken from the stations then adjusted to account for local factors like site changes, changes in instrumentation, time of observation and at least at one time for urbanization in USHCN Version 1 (Karl 1988). Data sets are created for the US (USHCN) and NOAA global data bases (GHCN).
Historical Central Park observations were taken from the periphery of the park from 1909 to 1919 at the Arsenal Building 5th Ave (between 63rd & 64th) and then since 1920 at the Belvedere Castle on Transverse Rd (near 79th & 81st).

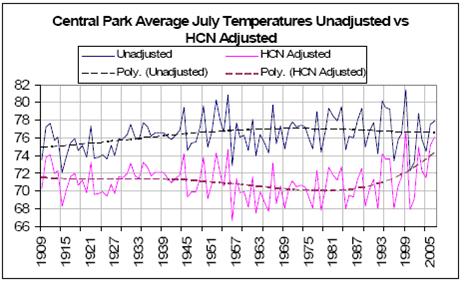
We found a surprisingly large difference from the NCDC United States USHCN version 1 and the NCDC global GHCN for that station (below, enlarged here).
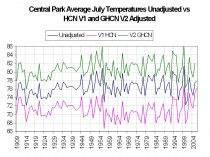
The USHCN version 1 had an urban adjustment (Karl 1988) when it was introduced in 1990. The cooling was as 7F for July and 6F for January. Notice however as some state climatologists noticed, the annual adjustments began to diminish in 1999 and in version 2 of USHCN disappeared altogether (below, enlarged here).
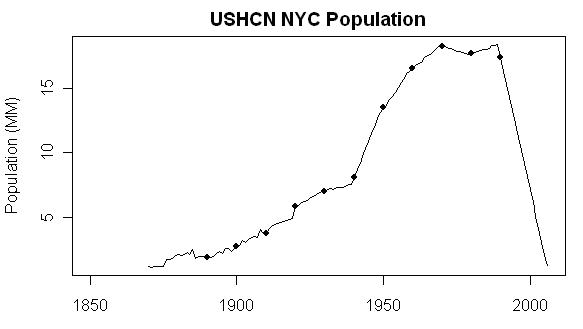
This led Steve McIntyre here to quip “If one reverse engineers this adjustment to calculate the New York City population used in the USHCN urban adjustment, the results are, in Per’s words, ‘gobsmacking’ (utterly astounding), even by climate science standards.” This was because, it could only be explained by a massive depopulation of New York City (below, enlarged here).
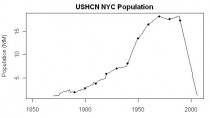
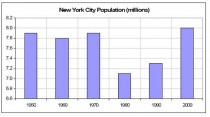
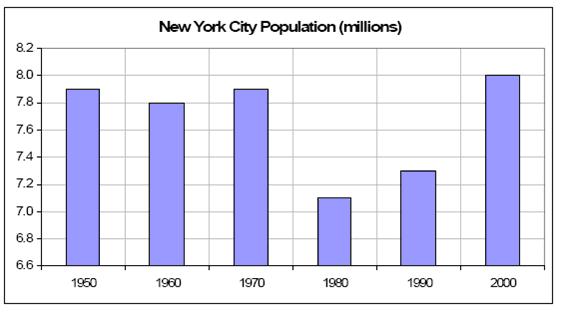
Shown clearly not the case (below, enlarged here).
The story doesn’t end there. The same NCDC maintains a global data base of station data used for climate change assessment called GHCN Version 2 of GHCN contains some of the same adjustments except for the Karl urban adjustment. Central Park is one of the GHCN sites. Note in the top graph above, it mysteriously warms not cools New York’s Central Park by 4F.
GISS USES GHCN AS UNADJUSTED DATA BEFORE HOMOGENIZATION
GISS recently eliminated GHCN with USHCN adjustments as one of the data access options here. “We no longer include data adjusted by GHCN”. They claim they start with GHCN ‘unadjusted’ before they work their own homogenization and other magical wonders.
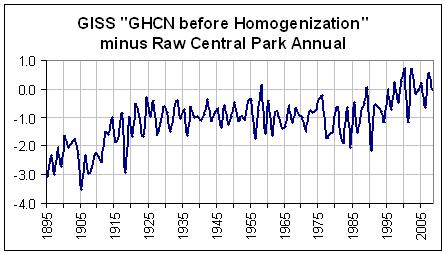
I downloaded the Central Park ‘unadjusted’ GHCN data from GISS and did a comparison of annual mean GHCN with the raw annual mean data downloaded from the NWS New York City Office web site here.
We found that the two data sets were not the same. For some unknown reason, Central Park was colder in the unadjusted data sets in the early record as much as 3F than the raw observation records. The difference gradually diminished so, currently the changes are small (2008 was the same). Some recent years the ‘unadjusted’ adjustments were inexplicably positive (below, enlarged here.
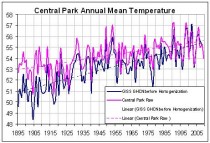
The difference is shown below, enlarged here.
Thus in the so called unadjusted data, the warming (due to urbanization) is somehow increased from 2.5 to 4.5F.
E.M. Smith downloaded the latest iteration of GHCN Central Park directly from NOAA and found it had found its way back closer to the raw data. He notes there are many iterations of the data sets out there. The differences is them is much greater than the changes over time calling into question our ability to accurately assess climate trends. See his discussion here.