

Joseph D’Aleo, CCM
Virtually every month and year we see stories in the once reliable media and from formerly unbiased data centers that proclaim the warmest such period in the entire record back to 1895 or earlier (often 1850).
In the ADDENDUM to the Research Report entitled: On the Validity of NOAA, NASA and Hadley CRU Global Average Surface Temperature Data & The Validity of EPA’s CO2 Endangerment Finding, Abridged Research Report, Dr. James P. Wallace III, Dr. (Honorary) Joseph S. D’Aleo, Dr. Craig D. Idso, June 2017 (here) provided ample evidence that the Global Average Surface Temperature (GAST) data was invalidated for use in climate modeling and for any other climate change policy analysis purpose.
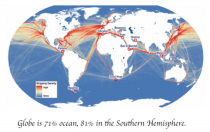
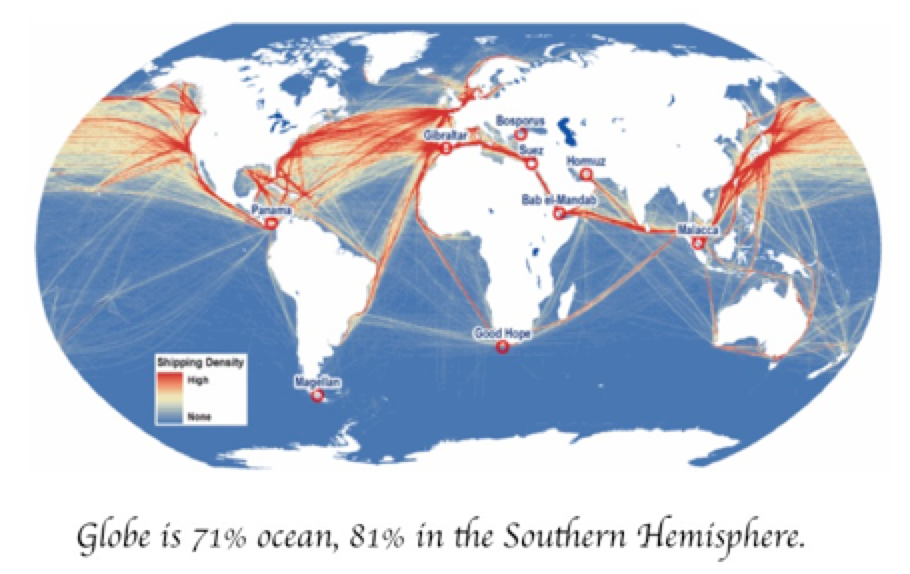
“The conclusive findings of this research are that the three GAST data sets are not a valid representation of reality. In fact, the magnitude of their historical data adjustments, that removed their cyclical temperature patterns, are totally inconsistent with published and credible U.S. and other temperature data. Thus, it is impossible to conclude from the three published GAST data sets that recent years have been the warmest ever - despite current claims of record setting warming. That is made even more true given that 71% of the earth’s surface is ocean and the only ocean data prior to the satellite era began in the 1970s was limited to ship routes mainly near land in the northern hemisphere.”
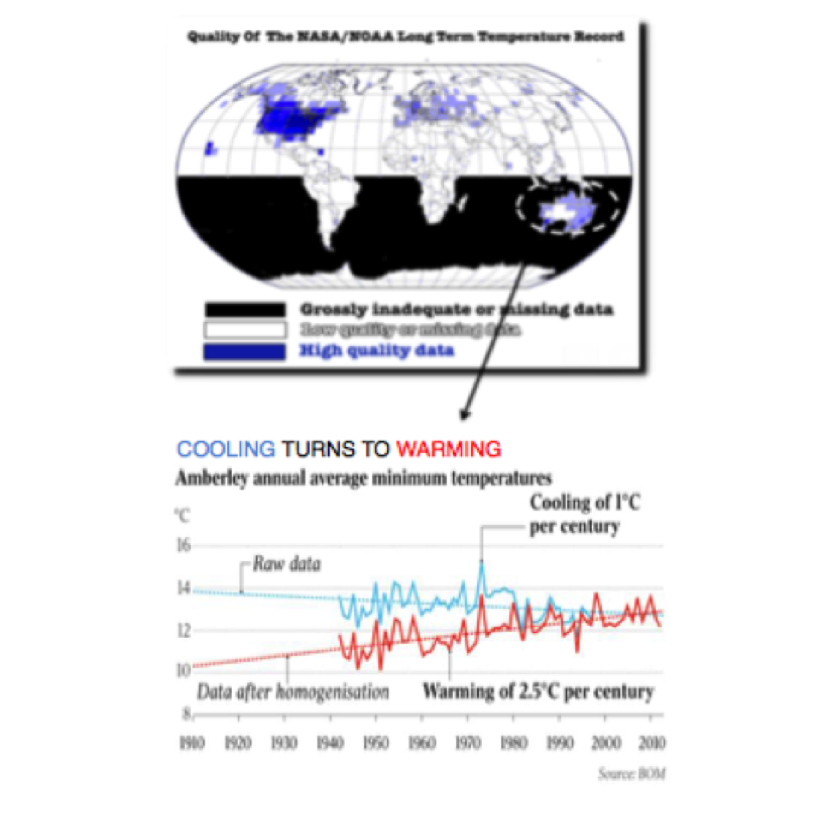
According to overseers of the long-term instrumental temperature data, the Southern Hemisphere record is “mostly made up”. This is due to an extremely limited number of available measurements both historically and even presently from Antarctica to the equatorial regions.
In 1981, NASA’s James Hansen et al reported that “Problems in obtaining a global temperature history are due to the uneven station distribution, with the Southern Hemisphere and ocean areas poorly represented."(Science, 28 August 1981, Volume 213, Number 4511(link))
In 1978, the New York Times reported there was too little temperature data from the Southern Hemisphere to draw any reliable conclusions. The report, prepared by German, Japanese and American specialists, appeared in the Dec. 15 issue of Nature, the British journal and stated that “Data from the Southern Hemisphere, particularly south of latitude 30 south, are so meager that reliable conclusions are not possible,” the report says. “Ships travel on well-established routes so that vast areas of ocean, are simply not traversed by ships at all, and even those that do, may not return weather data on route.”
This finding was amplified recently by MIT graduate Dr. Mototaka Nakamura in a book on “the sorry state of climate science” titled Confessions of a climate scientist: the global warming hypothesis is an unproven hypothesis.
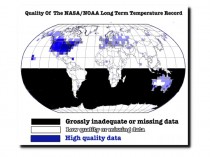
He wrote: “The supposed measuring of global average temperatures from 1890 has been based on thermometer readouts barely covering 5 per cent of the globe until the satellite era began 40-50 years ago. We do not know how global climate has changed in the past century, all we know is some limited regional climate changes, such as in Europe, North America and parts of Asia.”
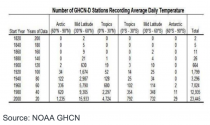
See how few land stations were in the databases in the early decades of the data window.
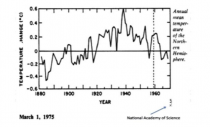
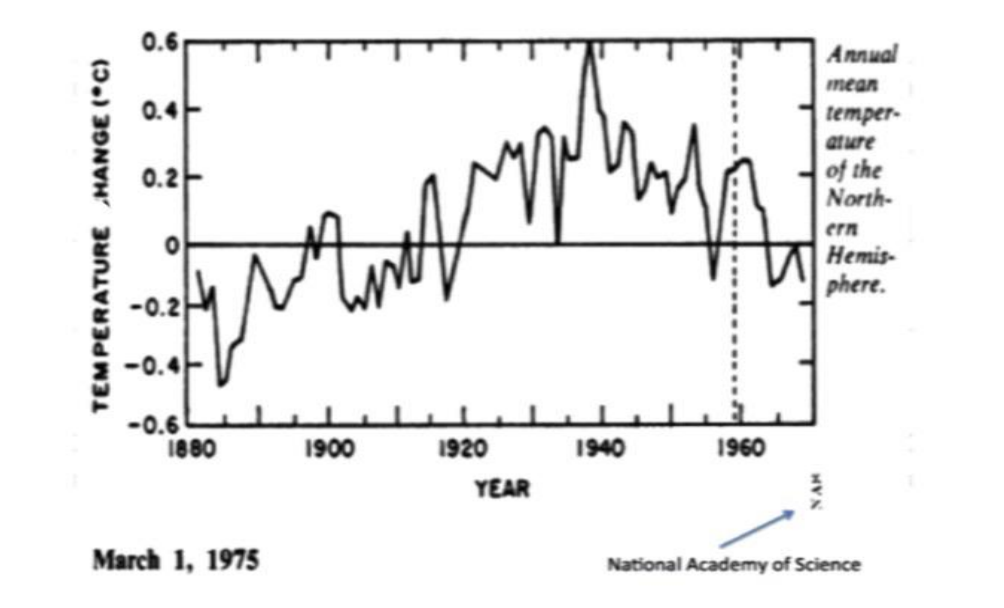
The National Academy of Science recognized this in their first attempt at determining a trend in temperature in the 1970s, which they limited to the Northern Hemisphere land areas. It showed a dramatic warming from the 1800s to around 1940 then a reversal ending in a matching cooling by the late 1970s when even the CIA wrote that the consensus of scientists we might be heading towards a dangerous new ice age.
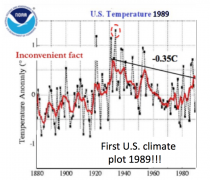
The first real-time temperature trend tracking was in 1989 - and was the US only as the US had the best surface station network and urban contamination was accounted for.
Tom Karl whose paper in 1988 defined the UHI adjustment for the first version of USHCN (which was removed in version 2) wrote with Kukla and Gavin in a 1986 paper on Urban Warming: “MeteoSecular trends of surface air temperature computed predominantly from urban station data are likely to have a serious warm bias… The average difference between trends, urban siting vs. rural, amounts to an annual warming rate of 0.34C/decade. The reason why the warming rate is considerably higher may be that the rate may have increased after the 1950s, commensurate with the large recent growth in and around airports. Our results and those of others show that the urban growth inhomogeneity is serious and must be taken into account when assessing the reliability of temperature records.”
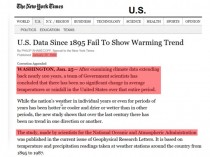
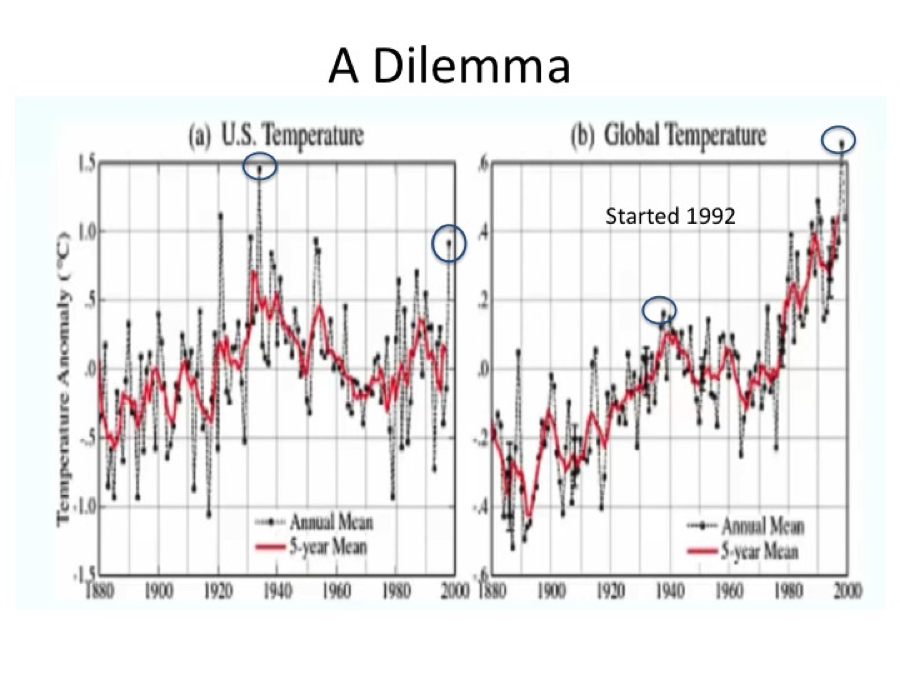
The NY Times reported the US Data failed to show warming trend predicted by Hansen in 1980.
Even in 1999, the temperature still trailed 1934 - James Hansen noted “The U.S. has warmed during the past century, but the warming hardly exceeds year-to-year variability. Indeed, in the U.S. the warmest decade was the 1930s and the warmest year 1934.”
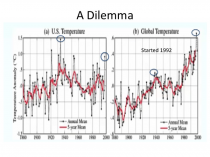
When the data centers were pressured to do the same with global data they faced a dilemma as station coverage was poor and station quality was unknown. The result without station quality control was a warming post 1980.
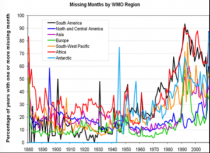
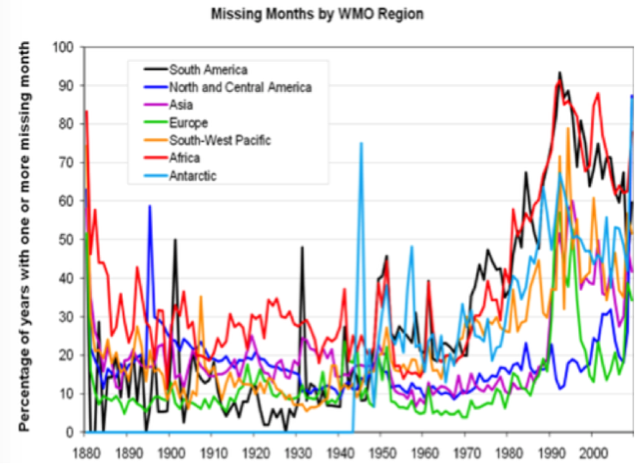
Even as the stations incorporated increased in number and coverage, their reliability became a challenge, with many large continents having a large percentage of missing months in the station data. That required the data centers to guess the missing data to get a monthly and then annual average.
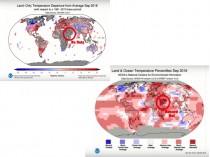
You may be surprised to see that continues today. This required guesswork allows those whose job is to validate their models the opportunity to make adjustments in ways to confirm their biases. See the initial data regions in September 2018 that were filled in by algorithms. It includes in a large data void region a record warmth assessment (Heller 2018).
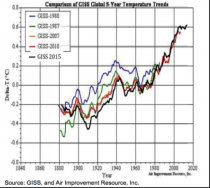
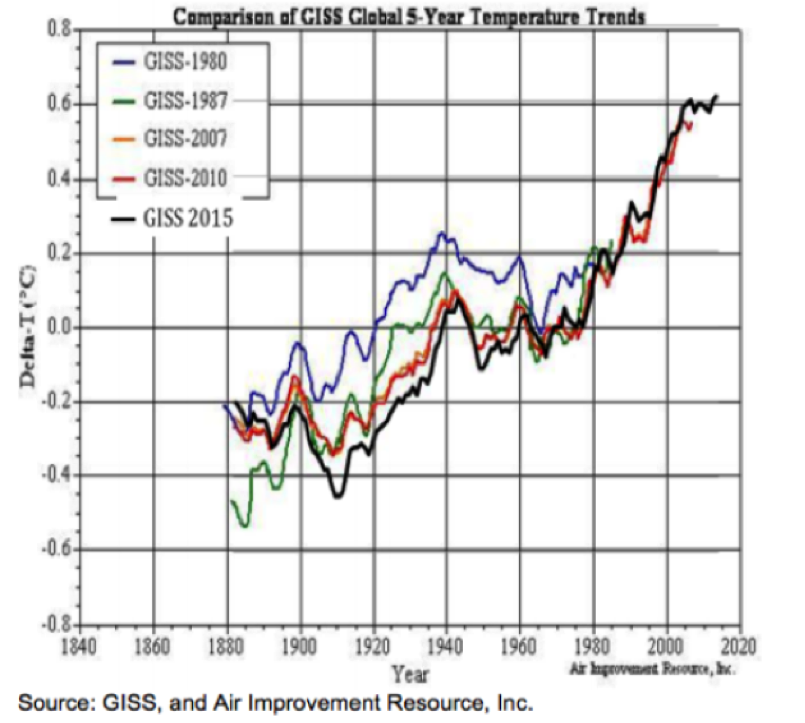
In our assessments, we found that each update cooled past years more and more which serves to make over time the trends more consistent with their model scenarios.
Here is the NASA GISS adaption of the NOAA GHCN data. Each update cools the past to make the trend upward more significant.
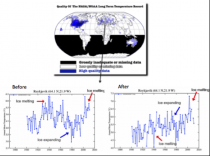
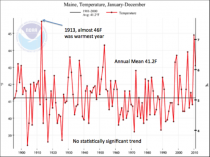
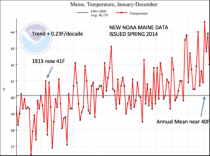
Even in areas with better data, station data was adjusted (corrupted) by the analysts to turn a cooling trend into the desired warming. We picked just three of many examples - one in Australia, the second in Iceland and the plot for the state of Maine.
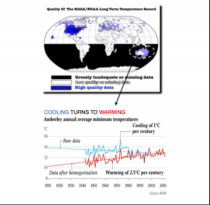
For Australia, many examples have been uncovered including Darwin and here Amberley. Blue was the original data plot, red is the one after adjustment in Australia.
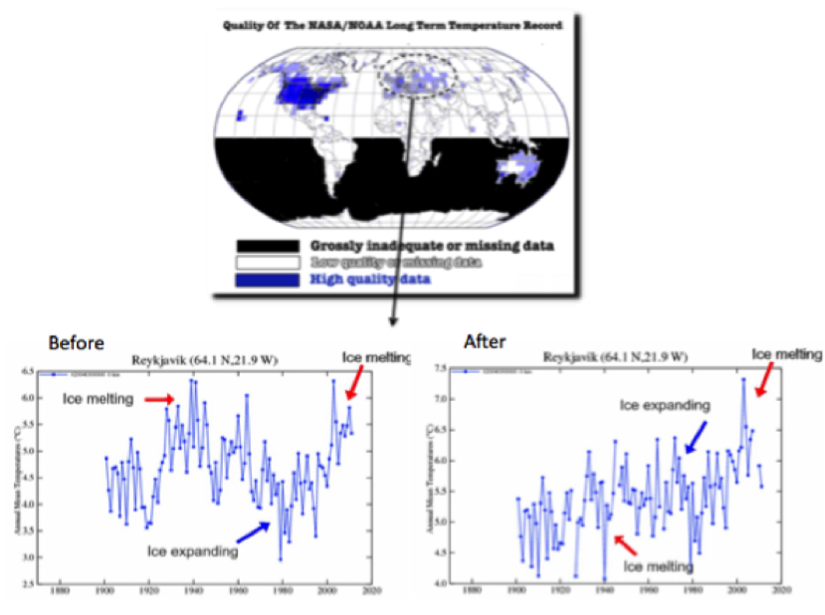
The NASA GISS plots for the Iceland raw and the adjusted data shows a cycle replaced by a linear warming ramp. The adjusted data was refuted by the Icelandic met department.
A new version of the US data appeared by 2010 and showed similar adjustments.
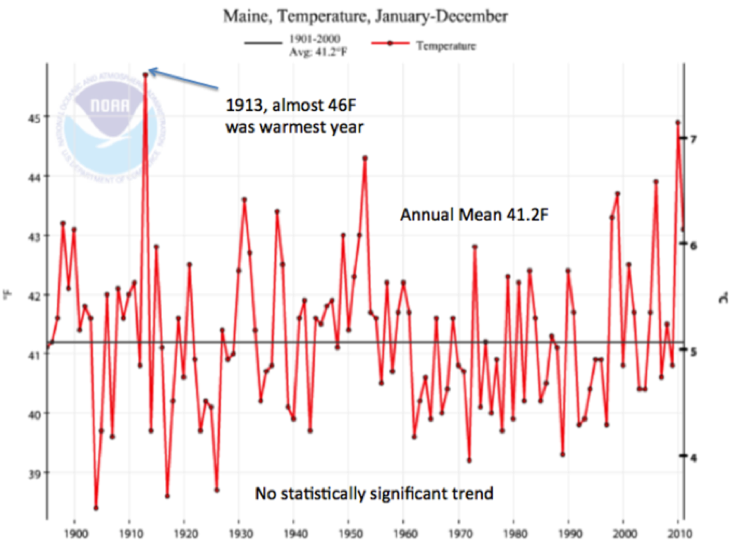
NOAAs Maine temperature trend was accessed in 2011 and again after 2013. The first showed no statistically significant trend from 1895 (-0.01F/decade) with the warmest year 1913. The second had a trend of +0.23F/decade with 1913 adjusted down almost 5F.
See the Climate Reference Network (stations sited by spec away from heat sources) plot of Monthly Average US temperatures since inception in 2005.
_thumb.png)
And the average monthly maximum temperatures for the US climate divisions.
_thumb.png)
.png)
.png)
Climategate emails exposed the true state of the data bases used to drive global policy decisions. Their own developers and their chief scientist were exposed and forced to acknowledge the data flaws. Ian ‘Harry’ Harris, the lead CRU climate data programmer and analyst in the ‘Climategate’ emails admitted to “[The] hopeless state of their (CRU) data base. No uniform data integrity, it’s just a catalogue of issues that continues to grow as they’re found… There are hundreds if not thousands of pairs of dummy stations...and duplicates… Aarrggghhh! There truly is no end in sight. This whole project is SUCH A MESS. No wonder I needed therapy!!” http://www.di2.nu/foia/HARRY_READ_ME-0.html
The CRU scientist at the center of the Climategate scandal at East Anglia University, Phil Jones after he thought the jig was up, made a candid admission on BBC that his surface temperature data are in such disarray they probably cannot be verified or replicated, that there has been no statistically significant global warming for the last 15 years and it has cooled 0.12C/decade trend from 2002-2009. Jones specifically disavowed the “science-is-settled” slogan.
Attempting to compile a ‘global mean temperature’ from such fragmentary, disorganized, error-ridden, geographically unbalanced ever-changing data with strong evidence of manipulation is more politically driven fraud than science.
As for the claims of increasing extremes - see a revealing fact check here.
The data supports the findings of the research mentioned above:
“The conclusive findings of this research are that the three GAST data sets are not a valid representation of reality. In fact, the magnitude of their historical data adjustments, that removed their cyclical temperature patterns, are totally inconsistent with published and credible U.S. and other temperature data. Thus, it is impossible to conclude from the three published GAST data sets that recent years have been the warmest ever - despite current claims of record setting warming.”
Support Icecap efforts to combat scientific fraud and environmental fanaticism with even a small donation via a secure access to Paypal - The safer, easier way to help online!