Jun 09, 2009
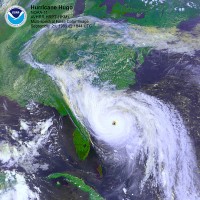
Atlantic Seasonal Hurricane Activity and Landfall Strike Probability for 2009
By Philip J. Klotzbach and William M. Gray
Information obtained through May 2009 indicates that the 2009 Atlantic hurricane season will be slightly less active than the average 1950-2000 season. We estimate that 2009 will have about 5 hurricanes (average is 5.9), 11 named storms (average is 9.6), 50 named storm days (average is 49.1), 20 hurricane days (average is 24.5), 2 major (Category 3-4-5) hurricanes (average is 2.3) and 4 major hurricane days (average is 5.0). The probability of U.S. major hurricane landfall and Caribbean major hurricane activity is estimated to be slightly below the long-period average. We expect Atlantic basin Net Tropical Cyclone (NTC) activity in 2009 to be approximately 90 percent of the long-term average. We have decreased our seasonal forecast from early April.
This forecast is based on an extended-range early June statistical prediction scheme that utilizes 58 years of past data. Analog predictors are also utilized. The influence of El Niño conditions is implicit in these predictor fields, and therefore we do not utilize a specific ENSO forecast as a predictor.
We expect current neutral ENSO conditions to persist or perhaps transition to weak El Nino conditions by the most active portion of this year’s hurricane season (August-October). If El Nino conditions develop, it would tend to increase the levels of vertical wind shear and decrease the levels of Atlantic hurricane activity. Another reason for our forecast reduction is due to the persistence of anomalously cool sea surface temperatures in the tropical Atlantic. Cooler waters are associated with dynamic and thermodynamic factors that are less conducive for an active Atlantic hurricane season. Another factor in our forecast reduction is the stronger-than-normal Azores High during April-May. Stronger high pressure typically results in stronger trade winds that are commonly associated with less active hurricane seasons.
Although we have been in an active multi-decadal Atlantic Basin hurricane era since 1995, it is not unusual to have a few below-average years within an active multi-decadal period. Likewise, it is not unusual to have a few above-average years within an inactive multi-decadal period. We expect the active Atlantic hurricane era that we have been in since 1995 to continue for the next 10-15 years. See forecast here.
Jun 07, 2009
June Snows in California, North Dakota, Canada and Great Britain
Rain, snow and a rescue from cold: Hypothermic symptoms in child hikers
Modesto Bee
Unseasonably wet and cold weather Friday resulted in fender benders, heavy snow and a rescue effort for schoolchildren who got cold on a Tuolumne County hike. Medics treated four children after they suffered hypothermic symptoms while on a camping trip with their Napa Valley charter school in the Pinecrest Reservoir area, according to the Tuolumne County Sheriff’s Department.
Sheriff’s spokesman deputy Ken Diaz said the children were in triage at a fire station Friday afternoon. Diaz said the children, along with school officials and two hiking guides, were out hiking Friday morning when the students began showing symptoms of hypothermia. He said authorities used a boat to pick up the children and take them to the fire station.
The California Highway Patrol is advising drivers to behave “as you would if you were driving in December.” Chains are required on Highway 108 east of Strawberry, and the California Department of Transportation closed Tioga Pass on Friday because of snow.
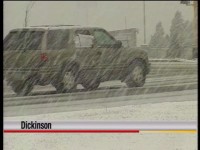
June Snow in Dickinson, North Dakota!
KFYR-TV
Even though it was June 6, but this is North Dakota, so the snow fell hard in Dickinson Saturday morning. It`s the first time in nearly 60 years the city has seen snow past May. NBC North Dakota News reporter Andrew Keller took a few measurements, and by our unofficial count, it looks like some places may have received two inches of snow. It was only raining in Bismarck and Williston, but snow was possible by late in the night.
“Even though it was June 6, but this is North Dakota, so the snow fell hard in Dickinson Saturday morning. It’s the first time in nearly 60 years the city has seen snow past May. NBC North Dakota News reporter Andrew Keller took a few measurements, and by our unofficial count, it looks like some places may have received two inches of snow. It was only raining in Bismarck and Williston, but snow was possible by late in the night.”
To the north, this photo from June 6 from Calgary in Canada courtesy of Madhav Khandekar.
It’s June...so it must be snowing - from sweltering to shivering in one week
By Colin Fernandez, UK Daily Mail
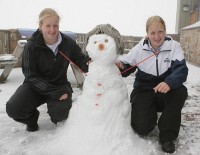
Five days ago we were flocking to the beach, queueing for ice-creams and slathering on the sunscreen. Yesterday, we were shivering in summer’s first dusting of snow. Yes, snow. After the hottest spell of the year so far, sleet and snow swept in across northern parts of Britain while the rest of the country also cooled down considerably. The Cairngorms in Scotland were the chilliest, with temperatures falling to zero while the Pennines and Cumbrian fells managed a mere 3c (37f).
Even by British summer standards, that is a remarkable weather turnaround. In the Cairngorms, two inches of snow meant visitors were able to build a rather surprised- looking summer snowman. And in the Pennines, snow was clearly visible on peaks above 2,300ft. It was already a chilly day before heavy rain falling across the Cumbrian fells and the north Pennines helped to lower the temperature sufficiently for the rain to turn to sleet, and then to wet snow,’ said meteorologist Stephen Davenport from the Meteo Group weather forecasters.
>
See more cold stories here.
Jun 07, 2009
Comment On Joe Romm’s Weblog On El Nino and Global Warming
By Roger Pielke Sr. Climate Science
Climate Progress has a weblog by Joseph Romm titled “Breaking: NOAA puts out “El Nino Watch,” so record temperatures are coming and this will be the hottest decade on record”.
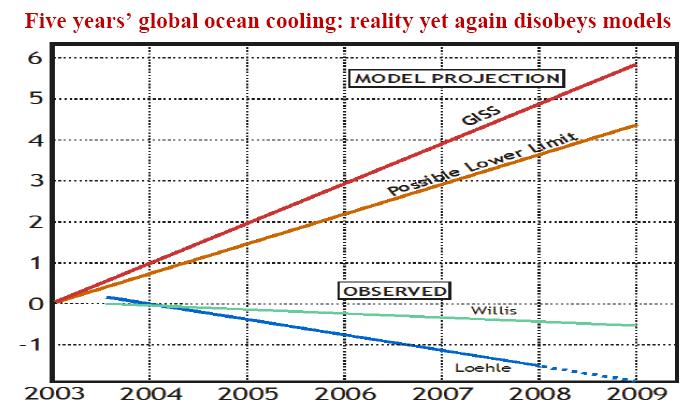
This is an interesting and very bold forecast of record temperatures by Joe Romm, and, if this does occurs, it would substantially support his claims on the dominance of human-caused global warming. Only time will tell, of course, if this warming will occur. However, unfortunately, he still does not understand that i) the appropriate metric to monitor global warming involves heat in Joules, most which occurs in the oceans (e.g. see), and ii) that the accumulation Joules in the upper ocean has not occurred since 2003 (e.g. see and see).
See larger chart here.
Even Jim Hansen agrees that the ocean is the dominant reservoir for heat accumulation (e. g. see).
In Joe Romm’s weblog, there is the text
“As a side note: Roger Pielke, Sr.’s “analysis” of how there supposedly hasn’t been measurable ocean warming from 2004 to 2008 is uber-lame. In the middle of a strong 50-year warming trend, any clever (but cynical) analyst can connect an El Nino-driven warm year to a La Nina-driven cool year a few years later to make it look like warming has stopped. In fact, the latest analysis shows “that ocean heat content has indeed been increasing in recent decades, just like the models said it should.
This text shows a failure to understand the physics of global warming and cooling. There are peer reviewed analyses that document that upper ocean warming has halted since 2003 (e.g. see and see). Even the last few years of the Levitus et al 2009 paper shows this lack of warming (see).
Joe Romm, since he disagrees with this, should present other observational analyses of the continued accumulation of heat content in Joules since 2003. He should also focus on this time period since the Argo network was established, as it is this data network which is providing us more accurate assessments of the heat content in the upper ocean than is found in the earlier data.
If he continues to use the global average surface temperature trends as the metric for global warming, he will convince us that he does not recognize i) that surface temperature, by itself, is not a meaasure of heat (e.g. see), and ii) that there are major remaining uncertainties and biases with the surface temperature data set (e.g. see, see and see).
He writes: “In the middle of a strong 50-year warming trend, any clever (but cynical) analyst can connect an El Nino-driven warm year to a La Nina-driven cool year a few years later to make it look like warming has stopped.”
He ignores that since 2003, global warming (the accumulation of Joules) has stopped. An objective scientist [as opposed to a “clever (but cynical) analyst"] would report this scientific observation. He would find more appreciation and respect for his viewpoints if he properly presented the actual observational finding, and discussed its implications as to where we are with respect to the accumulation of Joules over time. I have proposed such an approach in my weblogs here and here.
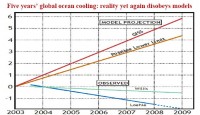
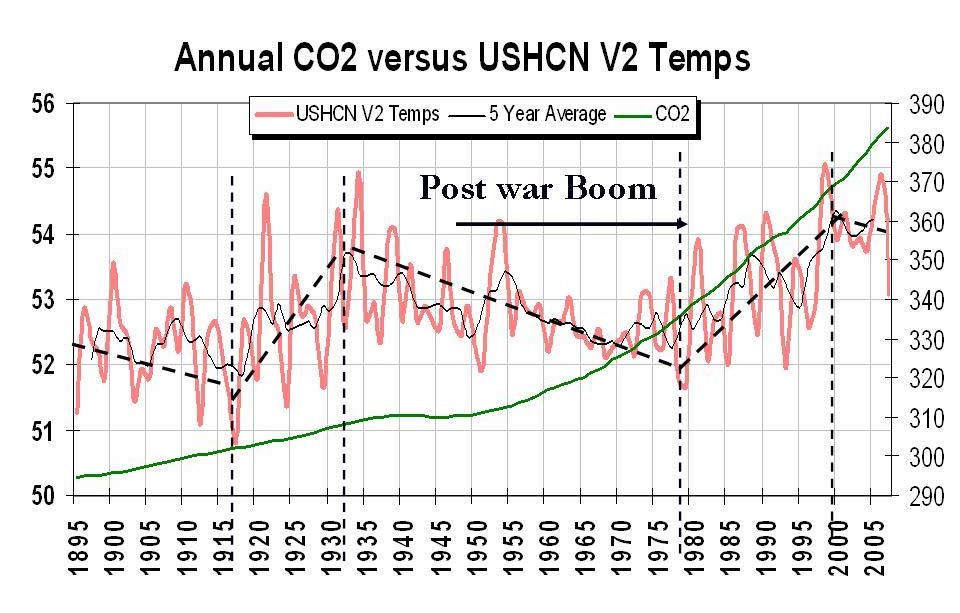
As usual Roger makes a strong case with a heavy dose of peer review. Romm’s case is weak. Notice Romm refers to a 50 year strong warming. Where? Even the contaminated global and USHCN data bases had a cooling or stasis from the 1940s to 1970s and again the last decade all while CO2 allegedly rose. That leaves only the 1979-1998 period that showed warming.

See larger graph here.
You notice Romm mentioned La Nina and El Nino but not PDO. That is because to admit to the PDO would be game, set and match for the climate realist case versus the alarmists as the PDO was warm during those 20 years and when the PDO is warm El Ninos dominate with accompanying warming. We had three times as many El Ninos as La Ninas those 20 years. Romm’s hyperactivity in recent days is a sign the end is near for the climate warming scam as predicted by Leon Festinger in When Prophecies Fail. Read 2008 story on that here.
Jun 03, 2009
Another Inspiring Heartland Climate Conference
By Joseph D’Aleo
A shortened but extremely relevant and timely one day conference was put on by the Heartland in DC to attempt to get the message to decision makers in time for the votes on important energy and climate legislation.

As Joe Bast indicated the purpose of the conference was to ask the tough questions about what we really know about the science and economics of global warming. For example:
Does new research indicate that the likely human effect on climate is less than previously thought?
Given there has been no warming for a decade and cooling now in its 8th year, does this undermine our confidence in computer global models?
What would it cost - in terms of higher prices for goods and slower economic growth to reduce emissions?
Would reducing greenhouse gas emissions in the United States have any effect on global temperatures?
There were 46 co-sponsors including Icecap. There were 18 speakers in the climate and economics of the legislation now being considered in congress. All talks will be posted on the Heartland.org website ASAP and linked to on Icecap.
The speakers on the climate showed the models are failing and why - my favorite take-away was Willie Soon’s comment ‘garbage in and gospel out’. Dr. Richard Lindzen and Dr. Roy Spencer showed the models dismal failures relate to the assumptions that clouds and water vapor deliver a strong positive feedback whereas satellite data shows the feedback is clearly negative. Lord Monckton got the same results through detailed analysis the of climate sensitivity (to greenhouse gases) which he showed was much smaller than the IPCC and other modelers conveniently assume.
The economists painted a very frightening picture of the cap-and tax Waman Markey bill. It is officially called a cap-and-trade to disguise the fact that it is a tax and as Michigan Democrat Dingell noted a “huge tax”. We heard numbers ranging as high as $4,600 per year per family including energy and cost of goods and service that will be forced to rise because of the changes made. Even James Hansen and Ralph Nader oppose cap-and tax as give-aways to special interests without doing any measurable good. At the conference, we heard that the changes even if adopted globally (highly unlikely) would not appreciably reduce carbon emissions nor affect global temperatures in any measurable way.
It would mark the biggest BAILOUT by far. The auto bailout cost 7 billion, the Geitner bailout (so-called stimulus) 787 billion. The Waxman Markey bill could exceed $9.4 trillion according to the Marshall Jeff Kueter with little if any measurable effect on global temperatures.
Though prospects for passage in the house are generally considered likely, there are questions about the senate. Please contact your representative and attend town hall meetings and let them and the other constituents what this bill is really all about and why it is based on faulty science and should be rejected. And remember to call it what it really is - a Cap-and-Tax plan.
Economist Dr. Gabriel Calzada of King Juan Carlos University in Madrid reviewed the dismal performance of cap-and-trade mandates in Spain, where unemployment has reached a daunting 18 percent, carbon emissions are higher today than before cap-and-trade was installed, and fraud and misrepresentation of emission abatement programs are rampant.
Calzada dismissed claims that such policies have created “green jobs” in the Spanish economy and presented data that showed Spanish businesses have spent billions of dollars on carbon credits and abatement programs, resulting in two jobs being lost in the regular economy or never being created for every one job created in the “green economy.”
Read the Heartland’s Dan Miller’s detailed summary here. Presentations will be posted here ASAP.
Read one of the few media stories about the conference in the Virginia Pilot here.
One of the attendees, an Australian Senator, Stephen Fielding came to hear an alternative to the dogma spit out by the Australian global warming community. The meeting left him questioning global warming hype as reported here.
Jun 02, 2009
Schneider Backs off Political Show Debate with Pielke Sr. ….unless
By Marc Morano, Climate Depot
Professor Stephen Schneider of Stanford University, a prominent proponent of man-made global warming fears, appears to be backing off of his boast that he could “slaughter” skeptical scientists in a global warming debate. In a May 24, 2009 interview, Schneider publicly boasted any skeptical scientist would be “slaughtered in public debate” against him.
But after many dissenting scientists happily took up the debate challenge, it now appears Schneider is shying away from any such debate.
“I certainly will not schedule some political show debate in front of a non-scientific audience,” Schneider told the San Francisco Examiner in a follow up June 1, 2009 article.
“A presidential like debate format with shallow staccato jibes and no nuanced arguments, no--confusion only in that style. I never do those anymore,” Schneider explained.
Former Colorado State Climatologist Dr. Roger Pielke Sr. publicly accepted Schneider’s global warming debate challenge just days after it was issued. “I would be glad to debate Dr. Schneider...he represents a narrow perspective on climate science,” Pielke Sr. said on May 24, 2009. [Editor’s Note: Climate Depot was copied on many emails from scientists writing to Professor Schneider accepting his debate challange and Climate Depot also received numerous notes from many scientists eager to accept Schneider’s debate challenge in the past week.]
“If [Climatologist] Roger [Pielke Sr.] wants a debate, he can set one up at the American Meteorological Society meeting or the American Geophysical Union meeting and if dates work I’ll be happy to go and will encourage others like Ben Santer or Kevin Trenberth to join in. That I would do,” Schneider now asserts. Read more here.
In other words, like the sports teams that prefer to play in the friendly confines of their home park than at a hostile away team’s stadium, Schneider insists on having the debate at one of the conferences attended by grant toting scientists and thus have a crowd of fellow alarmists to cheer him on and TO MAKE IT A FAIR FIGHT, wants to team up with Trenberth and Santer against Roger Pielke Sr.
|

