

Joe Bastardi
The Plain fact is there is no discernable slowdown of CO2 rise that is seen in other actual pollutants.
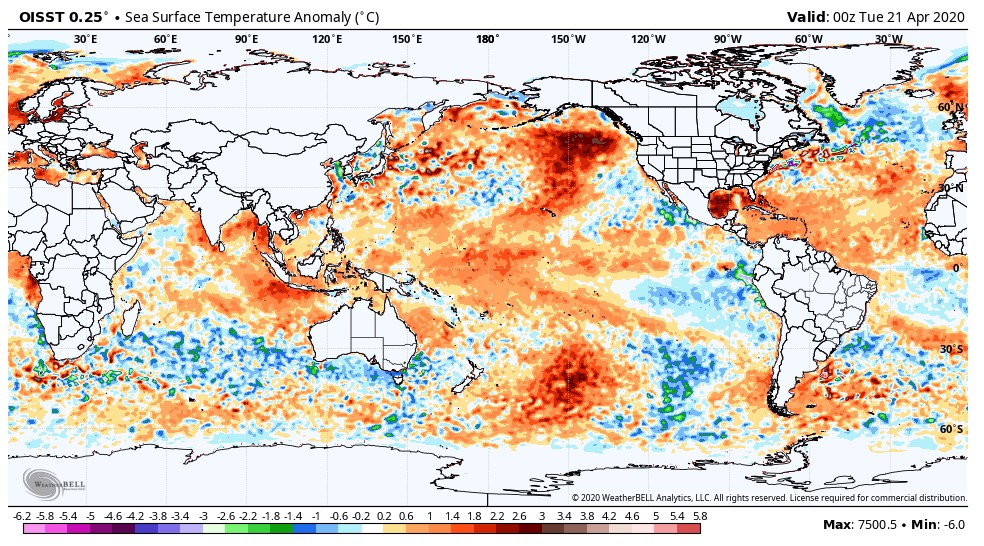
This is evidence that much of CO2 is likely increasing from a natural source, and warm oceans (just like water vapor) is a likely source.
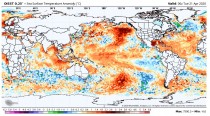
Oceans the biggest reservoir of CO2. A simple experiment - open a can of Coke and let it warm to room temperature. You will see it loses much of its fizz.
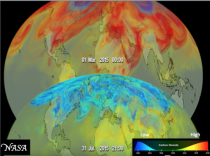
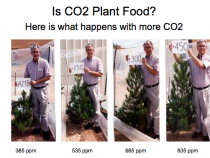
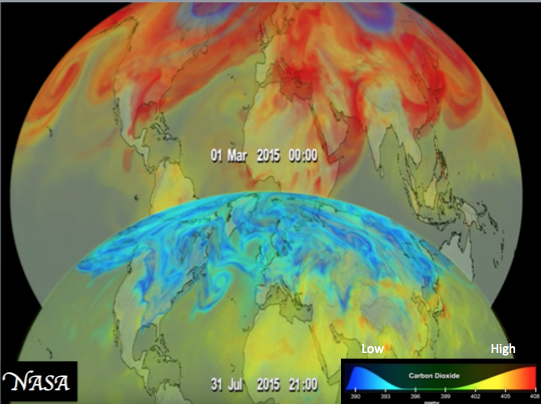
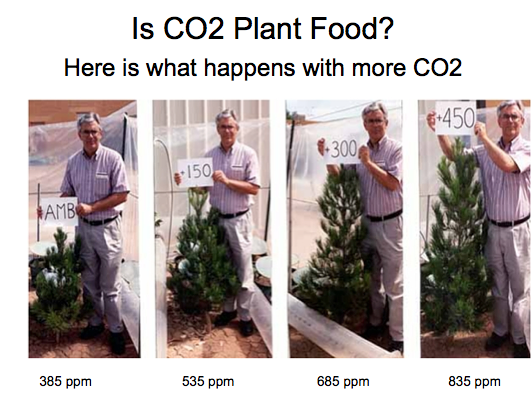
At the very least 2 things are obvious, 1) this is showing there is reason to question the origins of COs’s increase (note my words question, not just accept it blindly) and 2) That people pushing economic shutdowns as a way to combat global warming are apparently unaware of this glaring gash in their argument. CO2 is quick to react to changes. That is why you see the big downturns and upturns as the greening northern hemisphere demonstrate plants love of CO2 (solution plant trees) and what happens when they are not there (winter).
_thumb.png)
.png)
I suspect the amount of warmth in the oceans have not yet reached an equilibrium and are still in a positive outsourcing situation But the data is there. Mans output has shutdown, but the warm oceans is there So why the rise if its man.
Timothy Birdnow
This is the first time we had experimental data on this issue and it essentially fails to support the theory that carbon dioxide is being increased in the atmosphere by industrial emissions. It’s actually quite amazing; almost falsifies the whole theory. But we won’t hear anything about this in the mainstream media, and it’s doubtful even in science journals.
From NOAA ESRL
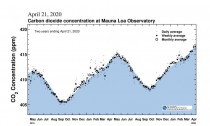
Can we see a change in the CO2 record because of COVID-19?
There have been many inquiries whether we can see in our CO2 measurements at Mauna Loa and elsewhere the slowdown in CO2 emissions from the burning of fossil fuels. That drop in emissions needs to be large enough to stand out from natural CO2 variability caused by how plants and soils respond to seasonal and annual variations of temperature, humidity, soil moisture, etc. These natural variations are large, and so far the “missing” emissions do not stand out, but we may see them as the year progresses. Here is an example: If emissions are lower by 25%, then we would expect the monthly mean CO2 for March at Mauna Loa to be lower by about 0.2 ppm. When we look at many years of the difference between February and March we expect March to be higher by 0.74 ppm, but the year-to-year variability (one standard deviation) of the difference is 0.40 ppm. This year the difference is 0.40 ppm, or 0.33 below average, but last year it was 0.52 ppm below average.
Most of the emissions come from urban areas, so that it may be easier to see the effect downwind of cities, although also in that case they need to stand out from natural variations. Only measurements of carbon-14 in CO2 would enable us to cleanly separate fossil sources of CO2 from ecosystem sources and sinks regardless of how variable the latter are.