Jan 05, 2009
Global Warming Unlikely Reason for Slow Coral Growth
By Jennifer Marohasy
Researchers in Australia say the growth of coral on the country’s iconic Great Barrier Reef (GBR) has fallen since 1990 to its lowest rate in 400 years, variations of this message have been repeated around the world from South Korea to London with global warming, and the associated acidification of oceans, claimed to be the cause. These reports are repeating claims in an Australian Institute of Marine Science (AIMS) media release made just last Friday to coincide with the publication of research findings in the journal Science.

The media release also claimed the research to be “the most comprehensive study to date on calcification rates of GBR corals”. Having followed GBR issues for many years I was surprised to hear global warming associated with slow coral growth rates, indeed AIMSs researchers Janice Lough and David Barnes have published detailed studies concluding that coral growth rates increase significantly with an increase in annual average sea surface temperature.
Furthermore growth rates actually decrease from north to south along the GBR as this corresponds with a cooling temperature gradient of 2-3 degrees C. If there has been a slowing in growth rates of coral over the last nearly 20 years, as suggested by this new research, a most obvious question for me would be: Have GBR waters cooled?
This new research paper in Science presents evidence for a decline in coral growth rates since 1990, but no credible reason for the decline. While the study hints that the cause could be ocean acidification no direct evidence is provided to support this claim - not even a correlation. Indeed no data is presented to suggest the PH (a measure of acidity) of GBR waters has changed, and based on modelling of hypothetical changes in PH associated with increases in atmospheric carbon dioxide there is a timing problem - the decline in calcification rates should apparently have started years earlier.
Confronted with a lack of evidence in support of this hypothesis - that ocean acidification has caused the drop in growth rates - the researchers suggest in the paper “synergistic effects of several forms of environmental stress” and implicate higher temperatures. But no data is presented in the paper to contradict the well established relationship between increasing temperature and increasing growth rates - though various confusing statements are made and it is suggested that global warming has increased the incidence of heat stress in turn reducing growth rates - while at the same time the researchers acknowledge higher growth rates in northern, warmer, GBR waters.
Marine Biologist Walter Starck has perhaps aptly described the research as part of “the proliferation of subprime research presenting low value findings as policy grade evidence” and has suggested this has “science headed in the same direction as Wall Street.” Read full post and more here
See this analysis by John McLean of ocean temperatures on the Great Barrier reef here. See this post here and a site full of information here.
Jan 04, 2009
Where Thermometers Go To Die - How Not to Measure Temperature
By Anthony Watts, WattsUpWithThat
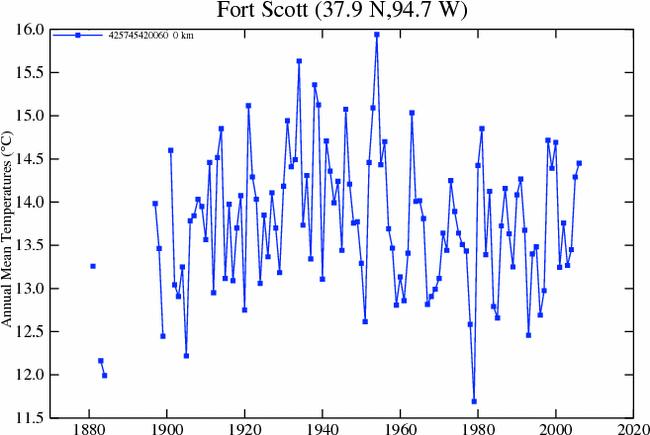
In my 30 years in meteorology, I never questioned how NOAA climate monitoring stations were setup. It wasn’t until I stumbled on the Marysville California fire station and its thermometer that that I began to notice just how badly sited these stations are. When I started looking further, I never expected to find USHCN climate monitoring stations placed at sewage treatment plants, next to burn barrels, or in parking lots of University Atmospheric Science Departments, or next to air conditioning heat exchangers. These were all huge surprises. I didn’t think I’d be surprised anymore. I thought I’d seen the weirdest of the weird, and that I would not be surprised again with bad station placement examples. Then I saw this station, submitted from Fort Scott, Kansas:
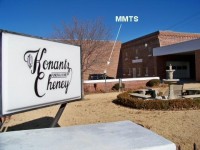
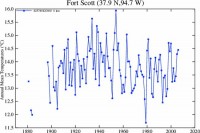
Yes, your eyes do not deceive you. That is an official NOAA USHCN climate monitoring station at a funeral home in downtown Fort Scott, KS. From a wider perspective, you can see all the things around it. Not only do we have a fountain (extra humidity), a nearby brick wall, a large concrete driveway that curves around the station, a tree for shade in the late afternoon, a big brick building with a south facing brick wall, but we also have cobblestone streets and convenient nearby parking. This location has everything needed, except a BBQ. See the complete photo gallery here. It seems that that station was moved into this location from the previous one about a block away on April 4th, 2008. Upon first examination. it appears that it “may” have been cooler at the previous location, once you get past the spike of the 1998 El Nino it seems the elevated step function remains. Though since the location was also downtown, about a block away, perhaps the UHI of the downtown has overwhelmed the station change.
Larger image here
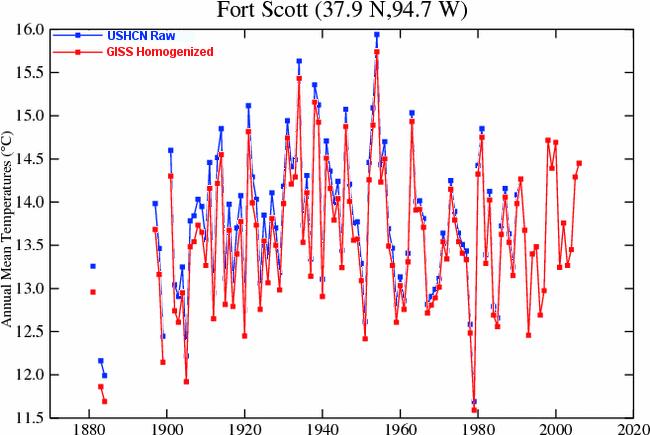
From what I can tell of the towns history, most of the growth in buildings occurred during the first half of the 20th century. Many of the downtown buildings seem to date from that time. Certainly it appears cooler around 1900. No worries though, GISS has “fixed the temperature to reflect a cooler past:
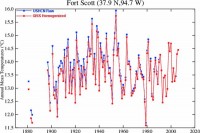
Larger image here
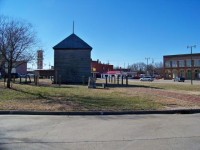
“A beautifully undulating prairie”. “An almost precipitous decent of fifty feet”. “A flat spur of high prairie”. “A small clear-water creek”. In 1852, Assistant Surgeon Joseph Barnes used all of these phrases to describe the landscape surrounding Fort Scott. Yes it probably was cooler in Fort Scotts past, when it looked like this, when it was founded:
Read full post and comments here.
Jan 04, 2009
Cross Country Race Canceled Because of Frigid Cold
AP News in the International Herald Tribune
Frigid temperatures forced organizers of the U.S. Cross Country Championship sprint race to cancel the event Saturday. Race organizers hoped to hold the sprint races on Sunday, if the cold snap that has gripped much of Alaska for the past week loosens its grip a bit. Forecasters, however, said the bitterly cold weather was expected to continue.
After several delays in which race organizers kept an eye on the temperature, the race at Kincaid Park was canceled mid-afternoon. Organizers watched as the mercury rose from 13 degrees below zero to about 6 below zero. In the end, it wasn’t enough, said race spokesman John Quinley. The cutoff for running the race is 4 degrees below zero.
Quinley said the event has been rescheduled for Sunday with an 11:30 a.m. start. Quinley also said the athletes were disappointed, but the temperature was still too cold and the sun was starting to go down. “They were disappointed,” Quinley said. “They were primed and ready to ski.”
Over 400 skiers are competing in the U.S. Cross Country Championship, now scheduled to be held from Sunday through Thursday. Anchorage’s Kikkan Randall, the best cross country skier in the nation, is competing, as well as many of the country’s top college skiers. Quinley said if Sunday also is too cold, it is possible to run the different events from Monday through Thursday with no rest days. Katie Ronsse, 23, a graduate of the University of Denver, is living in Anchorage and training at Alaska Pacific University, where Randall trains. She said when the skiers arrived at Kincaid Park on Saturday morning the temperature was 15 degrees below zero.
“It did warm up after the sun came out. It looked hopeful but it wasn’t quite warm enough,” she said. Tyson Flaharty, 23, of Fairbanks, said he’s used to training in much colder weather. “I don’t really mind the cold,” he said. “It doesn’t seem like it is that cold and the race would have been fun.” Temperatures in Fairbanks were 40 below on Saturday afternoon. Forecasters said it would dip to 50 below over the weekend.
Read story here.
See also this story out of Anchorage on the frigid weather.
Jan 02, 2009
Quantifying the US Agricultural Productivity Response to Solar Cycle 24
By David Archibald
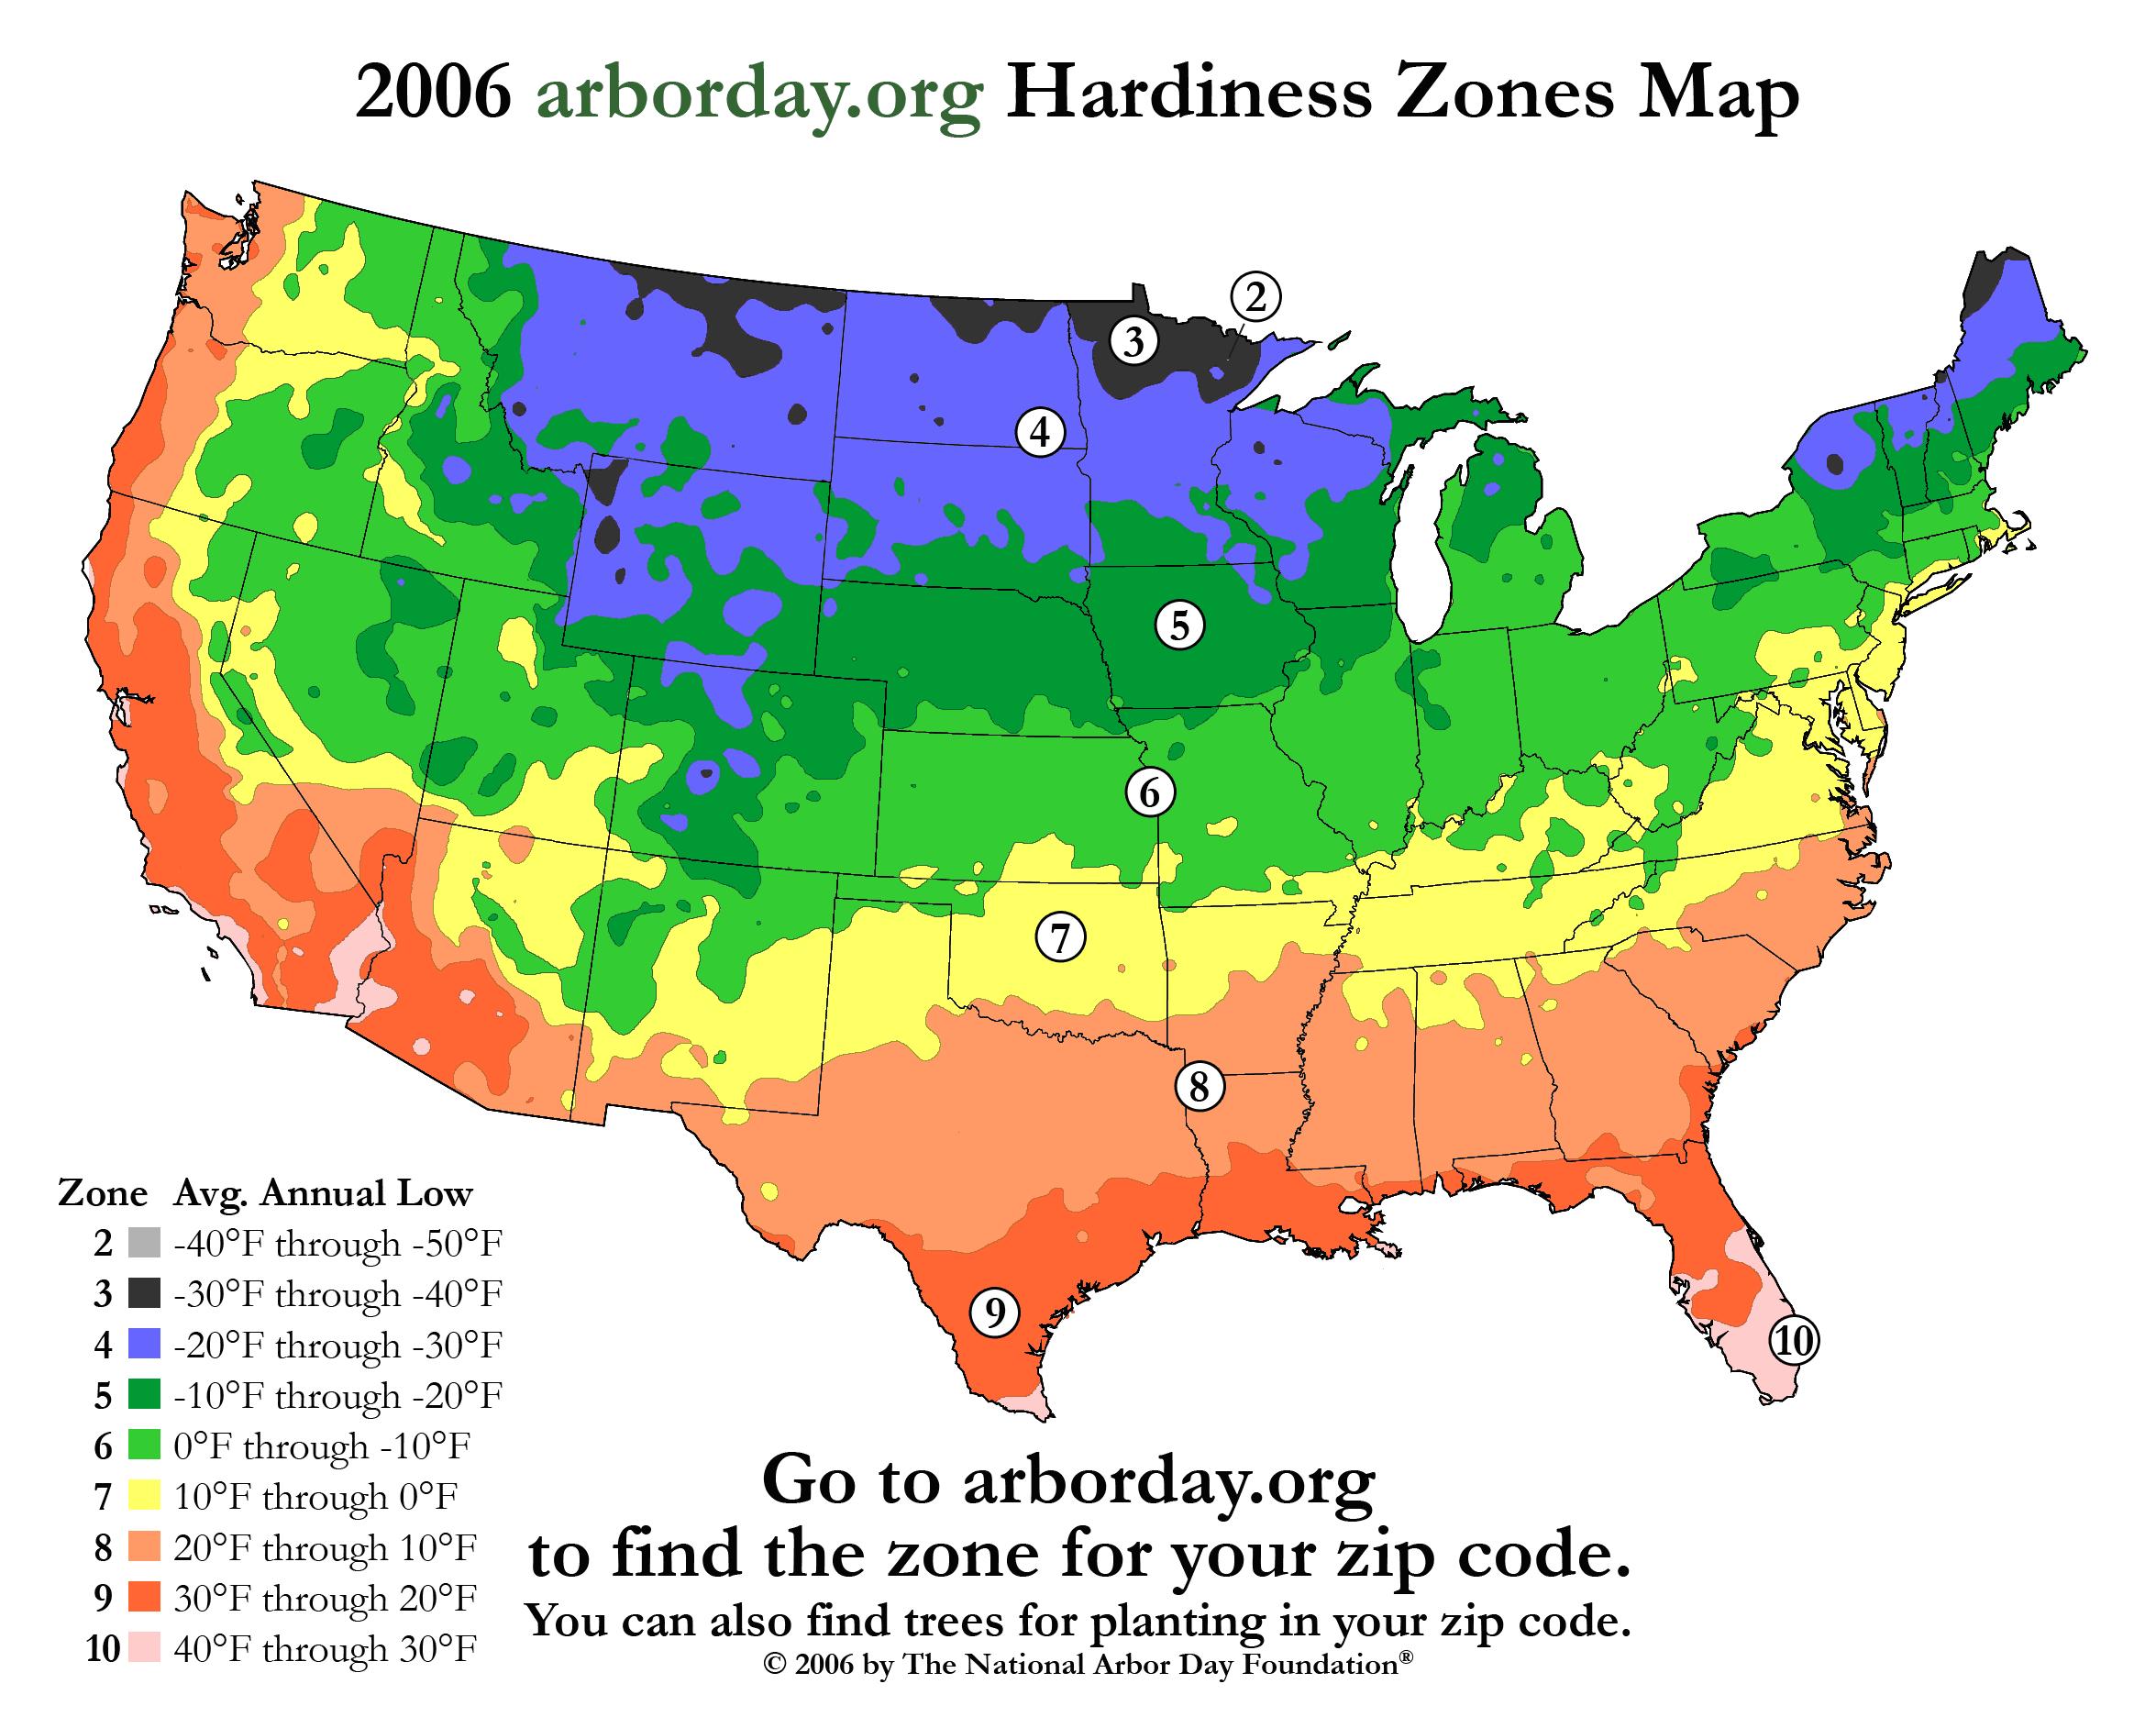
In 2006, The National Arbor Day Foundation updated the 1990 US Department of Agriculture map of plant hardiness zones for changes in the annual average minimum temperate over the intervening sixteen years (larger image here) from Arborday.org.
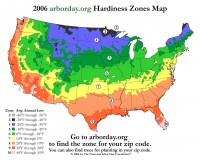
Relative to the location of the zones in the 1990 USDA map, hardiness zones have shifted northward by the following amounts relative to the latitude band:
30 N 110 km northward shift
35 N 200 km northward shift
40 N 280 km northward shift
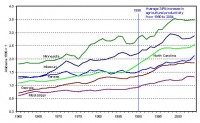
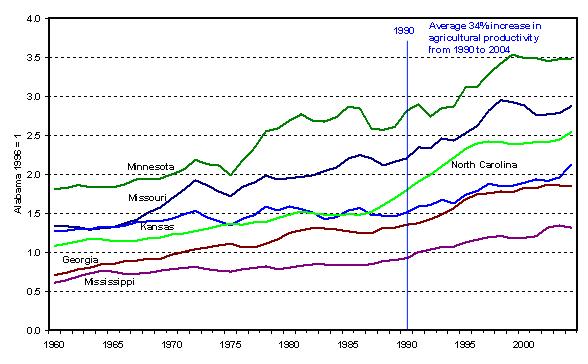
The improvement in growing conditions resulting from this northward shift in annual average minimum temperature caused an increase in agricultural productivity. Following is a graphic of the agricultural output of a number of US states accounting for 19% of US agricultural production:
Larger image here.
It is apparent from the graphic that there was a step change in the rate of increase of agricultural production at about the time the USDA plant hardiness zone map was created in 1990. Over the subsequent fourteen years, agricultural production in these six states rose 34%. The USDA state productivity data is available here. A proportion of the increase would have been due to the introduction of GM crops and other changes in agricultural practices. Nevertheless, the productivity growth is substantial and coincident with improved climatic conditions.
The change in plant hardiness zones over the 1990 to 2006 period is explained by solar cycle length changes. Solar Cycle 20 from 1964 to 1976 was 11.6 years long. Solar Cycle 21 was shorter than average at 10.3 years and Solar Cycle 22 from 1986 to 1996 was very short at 9.6 years long. There is a correlation between solar cycle length and temperature over the following solar cycle. In the mid-latitudes of the US north-eastern seaboard, this is 0.7 C for each year of solar cycle length. With the cumulative change in solar cycle length between Solar Cycle 20 and Solar Cycle 22 of two years, this would have translated to a 1.4 C increase in temperature by early this decade relative to early 1970s. This is reflected in the northward shift of plant hardiness zones as mapped by The National Arbor Day Foundation.
By virtue of a lack of Solar Cycle 23 sunspots, solar minimum of the Solar Cycle 23 to 24 transition appears to have been in late 2008. This makes Solar Cycle 23 three years longer than its predecessor. Consequently, using the 0.7 C per year of solar cycle length relationship, there will be a 2.1 C decline in temperature of the mid-latitudes next decade during Solar Cycle 24. Using the calibration provided by the climate shift caused by the Solar Cycle 20 to 22 change in solar cycle length, the following shifts in climatic zones, and thus growing conditions, are estimated:
30 N 160 km southward shift
35 N 300 km southward shift
40 N 420 km southward shift
Assuming that two thirds of the productivity increase in mid-western states from 1990 to 2004 was climatically driven, then the productivity decline in this region due to Solar Cycle 24 is expected to be of the order of 30%. The total US agricultural productivity decrease would be less than that at possibly 20%, equating to the export share of US agricultural production. See more here.
Jan 01, 2009
Global Warming? New Year Ushers in New Snowfall Records
By P.J. Gladnick, Newsbusters
As soon as your humble correspondent flipped on the TV set this New Year morning, he heard an MSNBC report about record levels of snowfall that just hit the Pacific Northwest. Checking around the web, it turns out that other parts of the country were also hit with record levels of snowfall. Here are a few of the reports starting with this one in the Green Bay Press Gazette: Green Bay ended the month with 45.8 inches of snowfall, the most of any December on record.
It buried the previous record of 36.4 inches, set in December 1887, but fell 2.6 inches short of matching the snowiest month of all time for Green Bay. That record goes to March 1888, with 48.2 inches, which helped the winter of 1887-88 become the snowiest winter in Green Bay history at 147.7 inches total.
And in the more liberal part of Wisconsin, Madison, the snowfall records are already tumbling as reported in the Wisonsin State Journal (data updated to December 31). The 44.7 inches already in November and December have virtually reached the 45 inches that normally falls in any given winter in these parts, with the brunt of winter (4 months) still to come. The record snowfall in December is now at 40.4 inches, breaking the previous December mark of 35 inches set in 2000 as well as the previous all month record mark of 37 inches that fell in February 1994.
I loved the movie Fargo and in that North Dakota city snowfall records also fell as you can see in this report: Fargo’s December snowfall total as of end of the year was 33.5 inches, which broke the previous record of 29.2 inches set in December 1927, according to the weather service. Grand Forks, ND also set a record with 30.1 inches of snowfall this December, compared to the previous record of 27.6 inches set back in 1918. Bismarck, ND, also set a snowfall record with 33.3 for the month (45.8 so far this season).
It will be interesting to see what the Global Warming Alarmists of the Boston Globe will make of this story which just appeared in their own newspaper yesterday: SPOKANE, Wash. - Spokane residents were trying to dig out yesterday after a record-breaking month of snow (an amazing 61.5 inches) collapsed roofs and clogged streets.
And how was the weather at midnight as the New Year was marked by the famous ball drop in Times Square? The New York Post describes the scene: In a fitting end to a miserable year that saw an economic meltdown, Wall Street’s collapse and massive job losses, bitter cold descended on New York to usher out 2008. Hundreds of thousands of bundled-up celebrants descended on the Crossroads of the World - huddled in blankets and shielded under umbrellas. Driving snow pounded many of the early-bird revelers throughout yesterday, and by midnight, the mercury had plummeted to 18 degrees. Howling wind gusts of up to 40 mph made it feel below zero at times.
So the New Year has been heralded in by record snowfall and bitterly cold temperatures but will the Global Warming Alarmists in the media notice? And will some enterprising reporter out there ask Al Gore how he can reconcile his Global Warming predictions with the incredibly cold weather we’ve been having recently including snowstorms in Las Vegas and snowfall in New Orleans?
Icecap Note; here is the preliminary temperature anomaly map for December 2008 (source: NOAA CPC)
See larger image here
|

