Mar 13, 2015
Even Though Warming Has Stopped, it Keeps Getting Worse?
by Dr. Roy Spencer
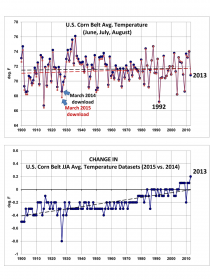
I was updating a U.S. Corn Belt summer temperature and precipitation dataset from the NCDC website, and all of a sudden the no-warmng-trend-since-1900 turned into a significant warming trend. (Clarification: the new warming trend for 1900-2013 is still not significantly different from zero at the 90% confidence level. H/T, Pat Michaels)
As can be seen in the following chart, the largest adjustments were to earlier years in the dataset, which were made colder. The change in the linear trend goes from 0.2 deg F/century to 0.6 deg. F/century.
Enlarged
Corn-belt-JJA-temperature-precip-1895-2013-diff-in-datasets
I know others have commented on the tendency of thermometer data adjustments by NOAA always leading to greater warming.
As Dick Lindzen has noted, it seems highly improbable that successive revisions to the very same data would lead to ever greater warming trends. Being the co-developer of a climate dataset (UAH satellite temperatures) I understand the need to make adjustments for known errors in the data...when you can quantitatively demonstrate an error exists.
But a variety of errors in data measurement and collection would typically have both positive and negative signs. For example, orbit decay causes a spurious cooling trend in the satellite lower tropospheric temperatures (discovered by RSS), while the instrument body temperature effect causes a spurious warming trend (discovered by us). The two effects approximately cancel out over the long term, but we (and RSS) make corrections for them anyway since they affect different years differently.
Also, the drift in satellite local observation time associated with orbit decay causes spurious cooling in the 1:30 satellites, but spurious warming in the 7:30 satellites. Again this shows that a variety of errors typically have positive and negative signs.
In contrast, the thermometer data apparently need to be adjusted in such a way that almost always leads to greater and greater warming trends.
How odd.
-----------
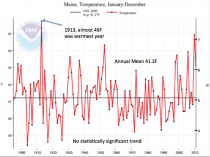
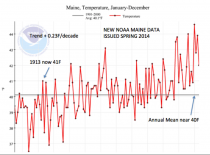
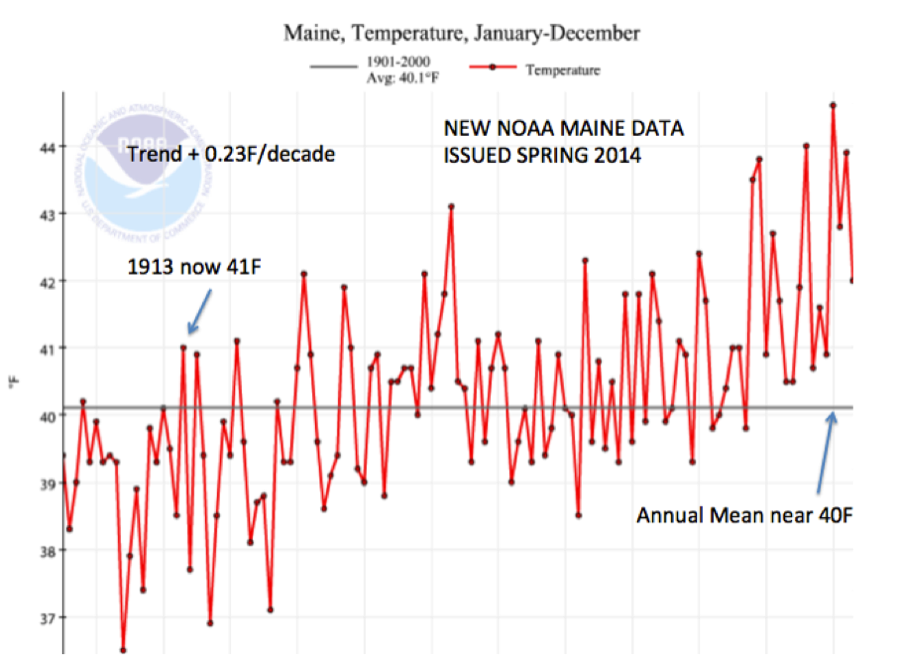
Like Roy, I have been burnt. I downloaded data from NCDC Climate at a Glance a few years ago that showed no warming (actually a small not statistically significant cooling). I ws asked to resprise my presentation this year and despite the cooler weather in recent years, when I downloaded it, the chart showed a significant warming trend that the Portland Press Herald reported on, claiming that Maine was warming faster than any other state. The change involved a dramatic cooling of the past and of the average to make the recent data rank constantly among the warmest and turn no trend into a significant warming one. Each iteration in the USHCN produces more cooling of the past and greated apparent warming. We are now at least at version 3.2.
Enlarged
Enlarged
Mar 07, 2015
Silencing skeptics - financing alarmists
By Paul Driessen
Will Congress and media examine government, environmentalist and university alarmist funding?
Sen. Edward Markey (D-MA), other senators and Congressman Raul Grijalva (D-AZ) recently sent letters to institutions that employ or support climate change researchers whose work questions claims that Earth and humanity face unprecedented manmade climate change catastrophes.
The letters allege that the targeted researchers may have “conflicts of interest” or may not have fully disclosed corporate funding sources. They say such researchers may have testified before congressional committees, written articles or spoken at conferences, emphasizing the role of natural forces in climate change, or questioning evidence and computer models that emphasize predominantly human causes.
Mr. Grijalva asserts that disclosure of certain information will “establish the impartiality of climate research and policy recommendations” published in the institutions’ names and help Congress make better laws. “Companies with a direct financial interest in climate and air quality standards are funding environmental research that influences state and federal regulations and shapes public understanding of climate science.” These conflicts need to be made clear, because members of Congress cannot perform their duties if research or testimony is “influenced by undisclosed financial relationships,” it says.
The targeted institutions are asked to reveal their policies on financial disclosure; drafts of testimony before Congress or agencies; communications regarding testimony preparation; and sources of “external funding,” including consulting and speaking fees, research grants, honoraria, travel expenses and other monies - for any work that questions the manmade climate cataclysm catechism.
Conflicts of interest can indeed pose problems. However, it is clearly not only fossil fuel companies that have major financial or other interests in climate and air quality standards - nor only manmade climate change skeptics who can have conflicts and personal, financial or institutional interests in these issues.
Renewable energy companies want to perpetuate the mandates, subsidies and climate disruption claims that keep them solvent. Insurance companies want to justify higher rates, to cover costs from allegedly rising seas and more frequent or intense storms. Government agencies seek bigger budgets, more personnel, more power and control, more money for grants to researchers and activist groups that promote their agendas and regulations, and limited oversight, transparency and accountability for their actions. Researchers and organizations funded by these entities naturally want the financing to continue.
You would therefore expect that these members of Congress would send similar letters to researchers and institutions on the other side of this contentious climate controversy. But they did not, even though climate alarmism is embroiled in serious financial, scientific, ethical and conflict of interest disputes.
As Dr. Richard Lindzen, MIT atmospheric sciences professor emeritus and one of Grijalva’s targets, has pointed out: “Billions of dollars have been poured into studies supporting climate alarm, and trillions of dollars have been involved in overthrowing the energy economy” - and replacing it with expensive, inefficient, insufficient, job-killing, environmentally harmful wind, solar and biofuel sources.
Their 1090 forms reveal that, during the 2010-2012 period, six environmentalist groups received a whopping $332 million from six federal agencies! That is 270 times what Dr. Willie Soon and Harvard-Smithsonian’s Center for Astrophysics received from fossil fuel companies in a decade - the funding that supposedly triggered the lawmakers’ letters, mere days after Greenpeace launched its attack on Dr. Soon.
The EPA, Fish & Wildlife Service, NOAA, USAID, Army and State Department transferred this taxpayer money to Environmental Defense, Friends of the Earth, Nature Conservancy, Natural Resource Defense Council, National Wildlife Fund and Clean Air Council, for research, reports, press releases and other activities that support and promote federal programs and agendas on air quality, climate change, climate impacts on wildlife, and many similar topics related to the Obama war on fossil fuels. The activists also testified before Congress and lobbied intensively behind the scenes on these issues.
Between 2000 and 2013, EPA also paid the American Lung Association well over $20 million, and lavished over $180 million on its Clean Air Scientific Advisory Committee members, to support agency positions. Chesapeake energy gave the Sierra Club $26 million to advance its Beyond Coal campaign. Russia gave generously to anti-fracking, climate change and related “green” efforts.
Government agencies and laboratories, universities and other organizations have received billions of taxpayer dollars, to develop computer models, data and reports confirming alarmist claims. Abundant corporate money has also flowed to researchers who promote climate alarms and keep any doubts to themselves. Hundreds of billions went to renewable energy companies, many of which went bankrupt. Wind and solar companies have been exempted from endangered species laws, to protect them against legal actions for destroying wildlife habitats, birds and bats. Full disclosure? Rarely, if ever.
In gratitude and to keep the money train on track, many of these recipients contribute hefty sums to congressional candidates. During his recent primary and general campaign, for example, Senator Markey received $3.8 million from Harvard and MIT professors, government unions, Tom Steyer and a dozen environmentalist groups (including recipients of some of that $332 million in taxpayer funds), in direct support and via advertisements opposing candidates running against the champion of disclosure.
As to the ethics of climate disaster researchers, and the credibility of their models, data and reports, ClimateGate emails reveal that researchers used various “tricks” to mix datasets and “hide the decline” in average global temperatures since 1998; colluded to keep skeptical scientific papers out of peer-reviewed journals; deleted potentially damaging or incriminating emails; and engaged in other practices designed to advance manmade climate change alarms. The Intergovernmental Panel on Climate Change based many of its most notorious disappearing ice cap, glacier and rainforest claims on student papers, magazine articles, emails and other materials that received no peer review. The IPCC routinely tells its scientists to revise their original studies to reflect Summaries for Policymakers written by politicians and bureaucrats.
Yet, EPA Administrator Gina McCarthy relies almost entirely on this junk science to justify her agency’s policies - and repeats EPA models and hype on extreme weather, refusing to acknowledge that not one Category 3-5 hurricane has made U.S. landfall for a record 9.3 years. Her former EPA air quality and climate czar John Beale is in prison for fraud, and the agency has conducted numerous illegal air pollution experiments on adults and even children - and then ignored their results in promulgating regulations.
Long-time IPCC Chairman Rajendra Pachauri has resigned in disgrace, after saying manmade climate change is “my religion, my dharma” (principle of the cosmic order), rather than a matter for honest, quality science and open, robust debate. The scandals go on and on: see here, here, here, here and here.
It’s no wonder support for job and economy-killing carbon taxes and regulations is at rock bottom. And not one bit surprising that alarmists refuse to debate realist scientists: the “skeptics” would eviscerate their computer models, ridiculous climate disaster claims, and “adjusted” or fabricated evidence.
Instead, alarmists defame scientists who question their mantra of “dangerous manmade climate change.” The Markey and Grijalva letters “convey an unstated but perfectly clear threat: Research disputing alarm over the climate should cease, lest universities that employ such individuals incur massive inconvenience and expense - and scientists holding such views should not offer testimony to Congress,” Professor Lindzen writes. They are “a warning to any other researcher who may dare question in the slightest their fervently held orthodoxy of anthropogenic global warming,” says Dr. Soon. Be silent, or perish.
Now the White House is going after Members of Congress! Its new Climate-Change-Deniers website wants citizens to contact and harass senators and congressmen who dare to question its climate diktats.
Somehow, though, Markey, Grijalva, et al. have not evinced any interest in investigating any of this. The tactics are as despicable and destructive as the junk science and anti-energy policies of climate alarmism. It is time to reform the IPCC and EPA, and curtail this climate crisis insanity.
Paul Driessen is senior policy analyst for the Committee For A Constructive Tomorrow (www.CFACT.org), author of Eco-Imperialism: Green power - Black death, and coauthor of Cracking Big Green: Saving the world from the Save-the-Earth money machine.
Mar 01, 2015
Green Slander
By Alan Caruba
It is a sure sign that the advocates of the “global warming” and “climate change” hoaxes know that the public no longer believes that the former is occurring or that the latter represents an immediate, global threat.
Even though the “climate skeptics”, scientists who have produced research proving false methodology and the conclusions based on it are quite few in number, an effort to silence them by smearing their reputations and denying funding for their work has been launched and it is based entirely on a lie.
Scientists are supposed to be skeptical, not only of other scientist’s findings, but their own. Good science must be able to reproduce the results of published research. In the case of the many computer models cited as proof that global warming was occurring or would, the passing years have demonstrated that none were accurate.
As Joseph L. Bast, president of The Heartland Institute and Joseph A. Morris, an attorney who has fought in several countries to defend free speech, wrote in a February 24 commentary, “The Crucifixion of Dr. Wei-Hock Soon”, of an article co-authored with Christopher Monckton, Matt Briggs, and David Legates, and published in the Science Bulletin, a publication of the Chinese Academy of Sciences “The article reveals what appears to be an error in the computer models used to predict global warming that leads models to over-estimate future warming by a factor of three.” (Emphasis added) Their commentary has been downloaded more than 10,000 times!
“If the work of Soon et al is confirmed by other scientists, the ‘global warming crisis’ may need to be cancelled and we can all enjoy lower taxes, fewer regulations, and more personal freedom.” However, “having failed to refute the article, environmentalists turned to smearing the authors.”
Little wonder the “Warmists” are worried; the Earth has been in a cooling cycle since 1996. People are noticing just how cold this record-breaking and record-setting winter is.
The attack on Dr. Soon began with a Greenpeace news release that was republished on the front page of The New York Times on February 22nd. Despite its august reputation, The Times’ coverage of climate issues has been an utter disgrace for decades. As public interest waned, it eliminated its staff of reporters exclusively devoted to writing about the “environment.”
Myron Ebell, a climate change skeptic and director of Global Warming and International Environmental Policy at the Competitive Enterprise Institute, noted on February 27th that the Greenpeace attack on Dr. Soon of the Harvard-Smithsonian Center for Astrophysics claimed they had secured $1.2 million in funding for his research over the past decade and that it came from energy corporations, electric utilities, and charitable foundations related to those companies. The truth, however, is “that the grants were made not to Dr. Soon but to the Smithsonian, which never complained while taking its sizable cut off the top.”
Columnist Larry Bell who is also an endowed professor at the University of Houston, disputed the Greenpeace claim, saying, “First, let’s recognize that the supporting FOIA documents referred to an agreement between the Smithsonian (not Dr. Soon) and Southern Company Services, Inc., whereby 40 percent of that more than $1.2 million went directly to the Smithsonian” leaving “an average funding of $71,000 a year for the past eleven years to support the actual research activities.”
Focusing on Greenpeace and its Climate Investigations Center which describes itself as “a group funded by foundations seeking to limit the risks of climate change”, Bell asked “Do these activist organizations make their estimated $360,000,000 annual funding publicly available?” Bell said “Ad hominem assaults disparaging the integrity of this leading authority on relationships between solar phenomena and global climate are unconscionable.”
In his article, “Vilifying realist science and scientists”, Paul Driessen, a policy advisor to the Committee for a Constructive Tomorrow (CFACT), noted that in 2012 Greenpeace USA was the recipient of $32,791,149 and that this is true of other environmental pressure groups that in 2012 secured $111,915.138 for the Environmental Defense Fund, $98,701,707 for the Natural Resources Defense Council, $97,757,678 for the Sierra Club, and, for Al Gore’s Alliance for Climate Protection, $19,150,215.
“All told,” noted Driessen, “more than 16,000 American environmental groups collect(ed) total annual revenues of over $13.4 billion (2009 figures). Only a small part of that comes from membership dues and individual contributions.” With that kind of money you can do a lot of damage to scientist’s reputation.
They fear that the public may actually learn the truth about “global warming” and the fear-mongering claims about “climate change” does not stop with just the environmental organizations. At the same time The New York Times was printing the Greenpeace lies, U.S. Senators Ed Market (D-Mass), Barbara Boxer (D-CA), and Sheldon Whitehouse (D-RI) joined together on February 25th to send letters to 107 companies, trade associations, and non-profit groups demanding comprehensive information about all funding of research on climate or related issues.
Among the groups receiving the letter were two for whom I am a policy advisor, The Heartland Institute and CFACT, but others include the Competitive Enterprise Institute, the George C. Marshall Institute, the American Legislative Exchange Council, and the American Energy Alliance.
Following The New York Times article, Rep. Raul Grijalva (D-AZ), the ranking Democrat on the House Natural Resources Committee, sent letters to the presidents of seven universities asking them to provide details about seven professors who are either prominent global warming skeptics.
As Rich Lowrey, editor of the National Review, pointed out on February 27th, that “Science as an enterprise usually doesn’t need political enforcers. But proponents of a climate alarmism that demands immediate action to avert worldwide catastrophe won’t and can’t simply let the science speak for itself.”
This is not fact-finding. It is an act of intimidation.
And it looks like a carefully organized effort to quash any research that might dispute “global warming” or “climate change” as defined by the Greens and by both the President and the Secretary of State as the greatest threat we and the rest of the world faces.
The greatest threat is the scores of environmental organizations that have been exaggerating and distorting their alleged “science” in order to thwart development here and around the world that would enhance everyone’s life. Now they are attacking real scientists, those who are skeptical of their claims, to silence them.
This is what fascists do.
Feb 23, 2015
NYT smears scientists Willie Soon for telling the truth about ‘global warming’
By James Delingpole
Another day, another attack on the integrity of the Harvard-Smithsonian astrophysicist Dr. Willie Soon, this time in the New York Times.
I first became aware of Soon in 2009 when reading through the Climategate emails. One of them was a jocular suggestion by a warmist called Tom Wigley as to how best to smear Soon and his co-author Sallie Baliunas.
Might be interesting to see how frequently Soon and Baliunas, individually, are cited (as astronomers). Are they any good in their own fields? Perhaps we could start referring to them as astrologers (excusable as..’oops, just a typo’ . .
You might be wondering what Soon and Baliunas had done to incur the wrath of the climate alarmist establishment. Well, they’d just published a meta-analysis of all the papers which had been written on the Medieval Warm Period (MWP). What their paper showed is that contrary to claims by one Michael Mann (the name may be familiar), the MWP was not a small, localised event but global, big and widespread.
So the memo went out from the Hockey Team (the uber-vindictive Mann and his lickspittle posse) to get Soon, and they’ve been going at him ever since: not by criticising the quality of his science - that would be too difficult because his science is impeccable - but simply by trying to make his life miserable, deny him tenure, and to smear him as compromised and corrupt.
The reason for the latest attack on Soon is that he is the co-author, with Christopher Monckton et al, of a paper published earlier this year in the prestigious Chinese Academy of Sciences journal Science Bulletin.
This study - Why Models Run Hot - infuriated the alarmist establishment, first because it was unusually popular (receiving over 10,000 views - thousands more than most scientific papers get) and second because it made a mockery of their cherished computer models.
As Paul Driessen explains:
Results from an irreducibly simple climate model, concluded that, once discrepancies in IPCC computer models are taken into account, the impact of CO2-driven manmade global warming over the next century (and beyond) is likely to be “no more than one-third to one-half of the IPCC’s current projections- that is, just 1-2 degrees C (2-4 deg F) by 2100! That’s akin to the Roman and Medieval Warm Periods and would be beneficial, not harmful.
Rather than attack the substance of the paper, the warmists reverted to their usual tricks, lead by Kert Davies, an activist lawyer who works for a Greenpeace front organisation called Climate Investigations Center.
Climate Investigations Center executive director (and former top Greenpeace official) Kert Davies told the Boston Globe it “simply cannot be true” that the authors have no conflict of interest over their study, considering their alleged industry funding sources and outside consulting fees. Davies singled out Dr. Willie Soon, saying the Harvard researcher received more than $1 million from companies that support studies critical of manmade climate change claims. An allied group launched a petition drive to have Dr. Soon fired.
Davies’ libelous assertions have no basis in fact. Not one of these four authors received a dime in grants or other payments for researching and writing their climate models paper. Every one of them did the work on his own time. The only money contributed to the Science Bulletin effort went to paying the “public access” fees, so that people could read their study for free.
I spoke to Soon last night. He told me that of course he receives private funding for his research: he has to because it’s his only way of making ends meet, especially since the Alarmist establishment launched its vendetta against him when, from 2009 onwards, he became more outspoken in his critiques of global warming theory.
Harvard-Smithsonian strove to make his life harder and harder, first by banning him from working on anything even remotely connected with issues like climate change or CO2, then by moving his office away from the astrophysics department to a remote area Soon calls Siberia. What the faculty couldn’t quite do was actually sack Soon because it had no cause: he was producing too many quality papers, and he was also bringing in too much money (40 per cent of which goes straight into the faculty coffers).
So there’s nothing new or scandalous about this latest New York Times hit job on poor Willie Soon. It’s just a continuation of a vendetta which has been waged for years against an honest, decent, hardworking - and incredibly brave - scientist who refuses to toe the official (and increasingly discredited) line on man-made global warming.
What most definitely is scandalous is the vile hypocrisy of Soon’s harrassment by the warmist establishment, which receives billions every year from the US government, left-wing charities, and billionaire activists like Tom Steyer and George Soros (and in the Boston Globe by the scientifically illiterate and uber-hypocritical Senator Markey whose reelection was funded by millions from ‘big green’) to prop up their bankrupt cause by promoting exactly the kind of junk science which Soon (and similarly principled scientists) have made it their business to shred.
The warmists are losing their argument. Their desperation is beginning to show.
Feb 15, 2015
Historic snows has ‘natural climate change’ deniers spinning
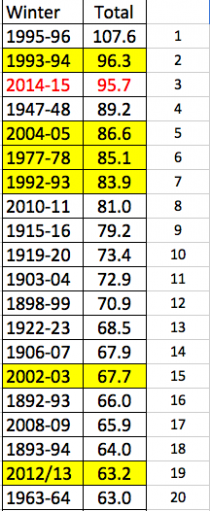
It was -2F Sunday in Boston and -3F pre-dawn Monday after the fourth major snowstorm in just over 3 weeks left behind 16.2 inches bringing the 23 day total to 90.2 inches. This may be the worst snow blitz since the Great Snows of 1717.
The total for the year is 95.7 inches, 3rd greatest for any season. It is just 0.6 behind 1993.94 (#2) and 11.9” behind the record of 107.6” (1995/96). The top 20 snow years are shown. the yellow years are the ‘analogs’ based on ocean, atmospheric and solar/lunar factors we used to predict a cold eastern winter this year and the historic one near the Great Lakes last year (7 of the top 20 years were analogs). Since we don’t have all the factors before 1950, we use analogs only after 1950. Some of the other years may have been good matches or analogs if we had that data for all the factors before 1950.
The average snow/melted ratio for the 4 big storms and the minor ones was about 18 to 1, which belies the idea the heavy snow was due to warm water hundreds of miles of the coast. Each of the major snows came with temperatures in the teens or lower. We have set records for February and any calendar month and likely snow depth (Blue Hill broke the 1995/96 record for snow depth).
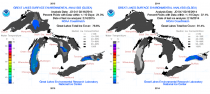
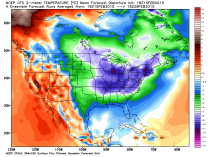
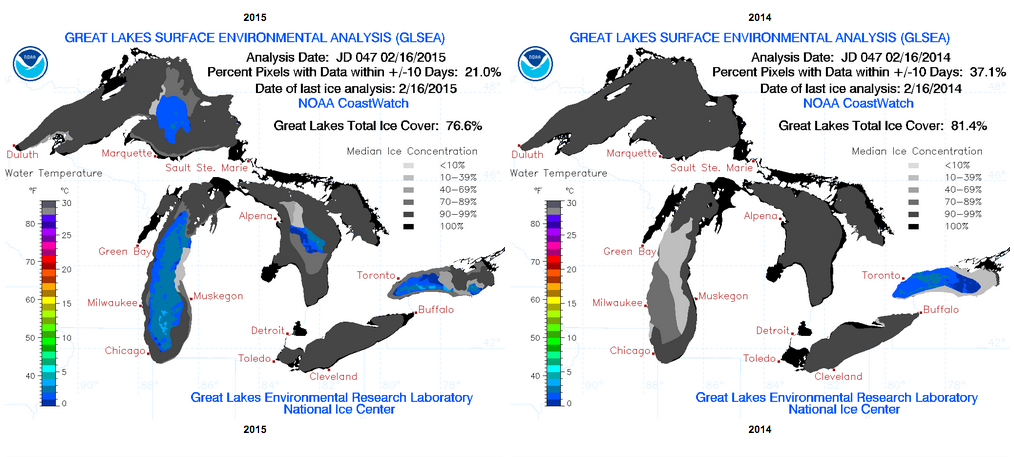
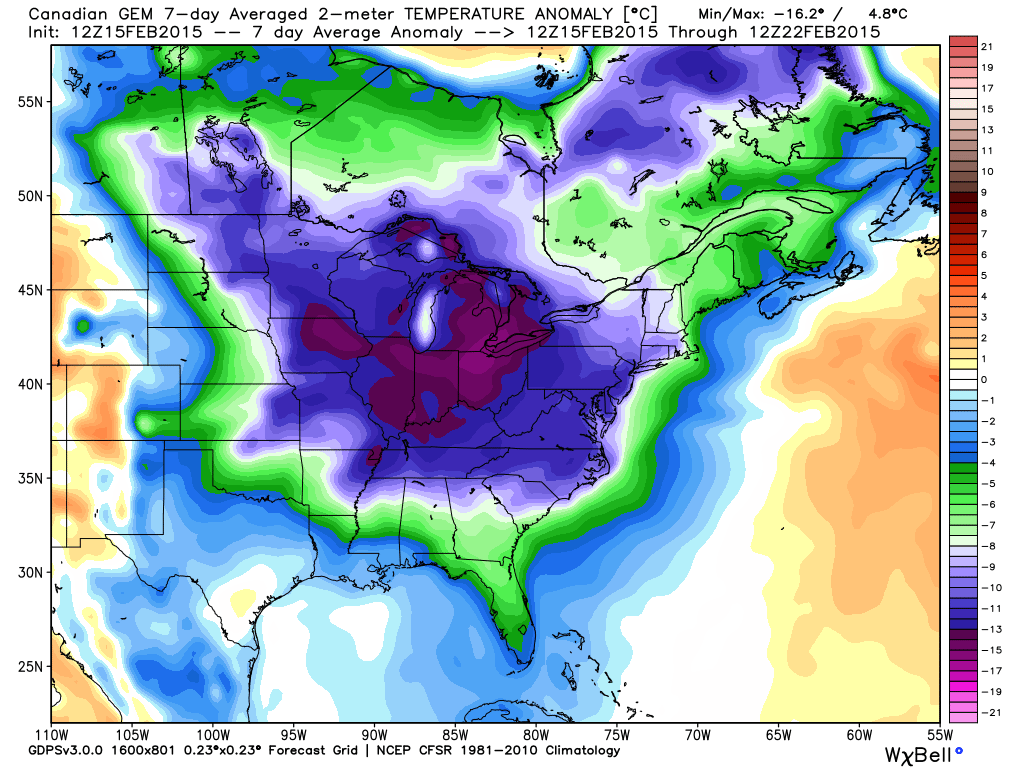
And now areas to the south and west will get heavy snows and ice while the Great Lakes sits in frigid sub zero cold the next 10 days which is causing ice to increase rapidly approaching last year’s record.
_thumb.png)
Enlarged
Enlarged
Enlarged
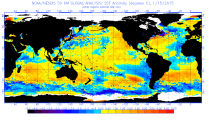
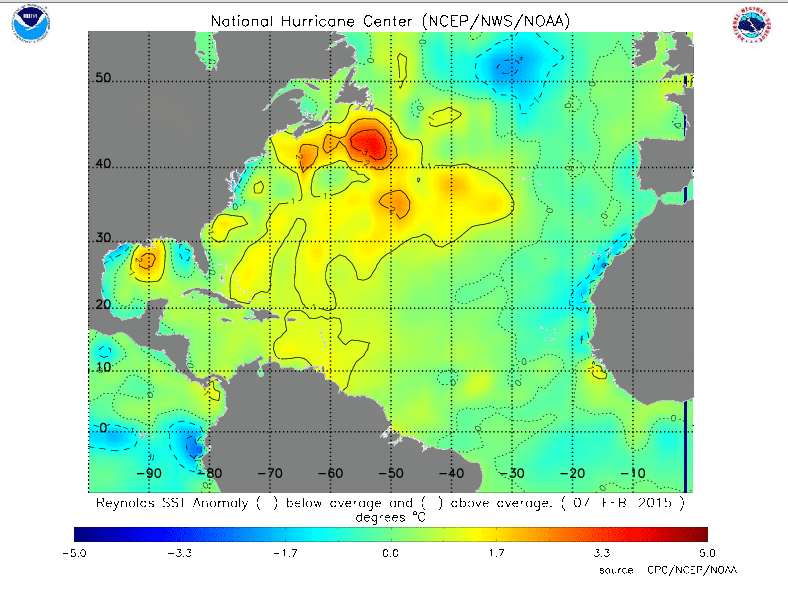
The warmists have proposed that global warming induced warming of the western Atlantic was responsible for the big Boston snows. Warm water they postulate means more moisture for snow and rain. While moisture feeds storms, you need contrast with very cold air to produce heavy snows and this year it is the cold that is driving the fluffy 90 inches of snow in Boston.
First of all as noted, the 90.2 inches of snow in the last 23 days in four nor’easters came from 5.02 inches of water. This 18 to 1 ratio is well above the normal 10-1 ratio in the ‘average storm. It is because the air is so cold with snow during the events falling with temperatures mostly in the teens.
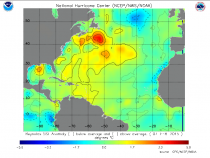
Also there is no evidence that the water just east of Cape Cod is 11.5 (21F) above normal as tweeted. NOAA’s National Hurricane Center Analysis showed water no more than 2 or 3C above normal well to the east of Cape Cod and with the very cold weather this month (over 11F below normal in the northeast), the water near the coast is colder than normal with ice forming. Ice is seen as far south as off the New Jersey Coast and will likely clog Boston and New York Harbor in the brutal cold of the next 10 days. Freezing spray warnings are in effect in the waters around NYC this morning.
Enlarged
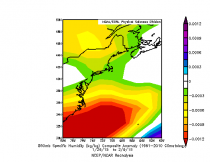
And the atmospheric water content (Specific Humidity) during the stormy period is BELOW NORMAL not above normal because the air is so cold on land and offshore.
Enlarged
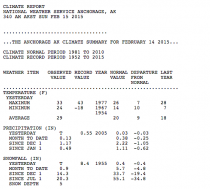
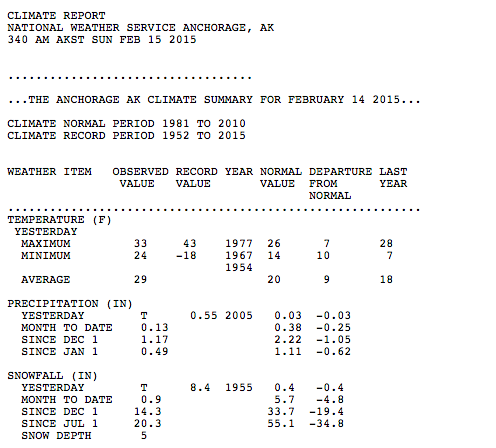
Let me give you another example. The water off of Alaska has been warm the last two years.
Enlarged
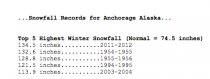
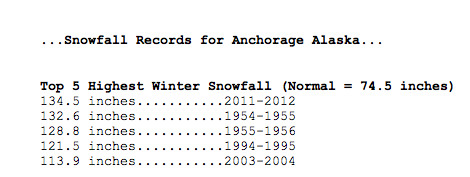
One who believes that drives heavy precipitation would surely believe this would generate well above normal snows in places like Anchorage in winter. Notice the snow this season to date has produced just 20 inches in Anchorage, 35 inches below normal.
Enlarged
The Gulf of Alaska water on the other hand was very cold in 2011/12. Record snows fell in Anchorage with temperature 14.5F below normal. Record Bering Sea sea ice also occurred.
Enlarged
Enlarged
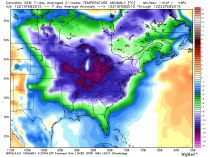
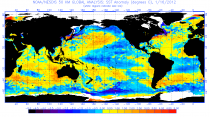
By the way Boston is rivaling February 1934 as the coldest month ever in Boston since 1872. So far, though today, Boston has averaged about 12.3F below normal for February. 1934 averaged -12.7F below normal. Some models are predicting the rest of the month to average 15F below normal, which would make this the coldest month of any month since 1872.
|


.png)