
|
Dec 16, 2008
NASA Models Can’t Get Simpler Mars Climate Right
By Irene Klotz, Reuters
NASA is still unable to say for sure whether its Phoenix lander has found a place where life could have existed on Mars.

But scientists working with the U.S. space agency said on Monday computer models they have been using to predict what the weather would be like on the Red Planet are wrong, and more accurate models would give a better picture of its past.
Speaking at the opening day of the American Geophysical Union conference in San Francisco, Phoenix mission scientists laid out the early harvest from five months of robotic operations on the northern polar region of Mars.
In addition to analyzing ice and soil samples for organic material, a process that is still under way, the Phoenix science team collected daily weather reports, information considered critical to learning if the planet could have supported water long enough for life to evolve. “It’s a very active weather environment,” lead investigator Peter Smith told reporters in a teleconference. “It’s a bit of a mystery how this is happening.”
Phoenix saw dusty summer days slip into cloudy fall, replete with ground fog, snow and frost. “Global climate models that are running on Mars would not predict this,” Smith said. “What we’re learning now about the polar region is going to force us to make changes.”
More accurate computer models would give scientists a clearer picture of what happened in Mars’ past, particularly when the planet’s axial tilt, or obliquity, was greater than it is now.
Without a large moon for stabilization, Mars’ polar regions periodically shift off axis by more than 35 degrees. During those times, the sun would rise higher in the sky above the Martian poles, making for warmer summers.
Scientists are trying to determine if there was ever a period of time when it would have been warm enough for water, considered a key ingredient for life as we know it.
“We’re really trying to understand if this was ever a wetter environment,” Smith said.
“If we can update these global circulation models and we can understand better about the polar weather, then we can look back in time to see if liquid water was ever a dominant influence on this soil in this location.”
Read more here.
Dec 16, 2008
Defying Predictions, Sea Level Rise Begins to Slow
By Michael Asher, Daily Tech
World’s oceans rise slower since 2005, fail to display predicted accelerating trend. Satellite altimetry data indicates that the rate at which the world’s oceans are rising has slowed significantly since 2005. Before the decrease, sea level had been rising by more than 3mm/year, which corresponds to an increase of about one foot per century. Since 2005, however, the rate has been closer to 2mm/year.
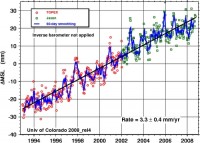
Source: University of Colorado, Boulder
The decrease is significant as global climate models predict sea level rise to accelerate as atmospheric CO2 continues to increase. In the 1990s, when such acceleration appeared to be occurring, some scientists pointed to it as confirmation the models were operating correctly. Sea level rise was calculated from altimetry data from the TOPEX/Poseidon and Jason-1 satellite missions, published by the University of Colorado, Boulder.
Dr. James Choe, a research associate with the University of Colorado, says the decrease is temporary. “Interannual variations often cause the rate to rise or fall”, he says. Choe believes an accelerating trend will reappear within the next few years. Oceanographer Gary Mitchum of the University of South Florida, says making any judgement from the limited data available is “statistically so uncertain as to be meaningless”.
Others disagree. Dr. Vincent Gray, a New Zealand based climatologist and expert reviewer for the IPCC, believes that the accelerated trends seen earlier were simply an artifact of poor measurements. “The satellite system has undoubtedly shown a rise since 1992, but it has leveled off”, he tells DailyTech. “They had some bad calibration errors at the beginning.” Gray points to a study done by Flanders University using tide gauges which, he says, measured no perceptible increase in sea level over its entire 15 year period.
Sea level has been rising since the end of the last ice age, some 20,000 years ago. During an episode known as “Meltwater Pulse 1A”, the world’s oceans rose by more than 5 meters per century, a rate about 20 times faster than the current increase. TOPEX/Poseidon was launched by NASA in 1992, and collected data until 2005. In 2001, NASA and France’s Centre National d’Études Spatiales (CNES) launched its follow-up mission, Jason-1. Jason-2 was launched in June of this year. Read more here.
Dec 14, 2008
Global Warming is Caused by Computers
Climate Skeptic
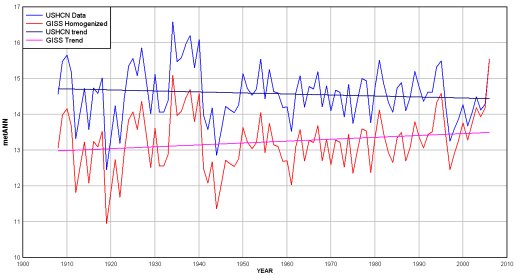
In particular, a few computers at NASA’s Goddard Institute seem to be having a disproportionate effect on global warming. Anthony Watts takes a cut at an analysis I have tried myself several times, comparing raw USHCN temperature data to the final adjusted values delivered from that data by the NASA computers. My attempt at this compared the USHCN adjusted to raw for the entire US:
See animation before and after adjustment here.

See larger image here.
Anthony Watts does this analysis from USHCN raw all the way through to the GISS adjusted number (the USHCN adjusts the number, and then the GISS adds their own adjustments on top of these adjustments). The result: 100%+ of the 20th century global warming signal comes from the adjustments. There is actually a cooling signal in the raw data:
Now, I really, really don’t want to be misinterpreted on this, so a few notes are necessary:
Many of the adjustments are quite necessary, such as time of observation adjustments, adjustments for changing equipment, and adjustments for changing site locations and/or urbanization. However, all of these adjustments are educated guesses. Some, like the time of observation adjustment, probably are decent guesses. Some, like site location adjustments, are terrible (as demonstrated at surfacestations.org).
The point is that finding a temperature change signal over time with current technologies is a measurement subject to a lot of noise. We are looking for a signal on the order of magnitude of 0.5C where adjustments to individual raw instrument values might be 2-3C. It is a very low signal-noise environment, and one that is inherently subject to biases (researches who expect to find a lot of warming will, not surprisingly, adjust a lot of measurements higher).
Warming has occurred in the 20th century. The exact number is unclear, but we have much better data via satellites now that have shown a warming trend since 1979, though that trend is lower than the one that results from surface temperature measurements with all these discretionary adjustments. See full post here.
Dec 12, 2008
Record Early Snow in New Orleans and Houston
By The Times-Picayune
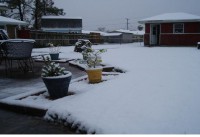
New Orleans Metro area residents woke up to falling snow on Thursday, December 11, 2008. Snow in New Orleans is a rarity. The last time it snowed was Christmas 2004; before that, the last snow recorded was in 1989, according to Jim Vasilj, a forecaster with the National Weather Service. Since 1850, snow had fallen in “measurable amounts” rather than traces in the city just 17 times, Vasilj said. Of the 17, today’s snowfall was the earliest in the season recorded. As much as 6 inches had piled up in Livingston Parish as of 10 a.m., Vasilj said. Similar amounts were reported in Bogalusa and St. Helena Parish, while in Mandeville, between 2 and 3 inches had accumulated, according to Vasilj.
For the first time in nearly four years, snow fell across the New Orleans region this morning, with flurries reported on the north shore and in the city, Metairie, Kenner, LaPlace and other parts of the south shore. By around 10 a.m., the snow had mostly stopped, replaced by freezing rain in many places, making driving treacherous. By noon, the precipitation had mostly ceased altogether.

By mid-morning, enough snow had accumulated on the ground in some areas to lure children and adults onto their front lawns to build snowmen or have snowball fights. In the city, neutral grounds remained blanketed in white, though the streets generally remained clear as the wet stuff melted upon hitting the pavement. In Mandeville, where the snow was heavier, lawns were covered with thicker blankets of white fluff as school buses filled with squealing students made the rounds. Children, most seeing snow for the first time Christmas Day 2004, tried to catch flakes in their hands as the buses rumbled along.
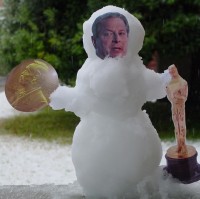
While snow in the Deep South is a pleasant novelty, the weather did cause trouble for some. A handful of schools and universities shut down for the day, bus service was disrupted, and flights at Armstrong International were cancelled or delayed. Outages were also reported in St. Tammany and Washington parishes, with the majority in the Franklinton area, according to Cleco spokeswoman Robbyn Cooper. Cleo has a total of nearly 7,000 power outages statewide, most of them in Allen, Evangeline, Acadia and St. Landry parishes. Read more here. Last night Houston too had the earliest snow on record. See also this official NWS summary of the snowfall in the New Orleans area last week. And courtesy of our friends at the METSUL who found this New Orleans Gore Snowman.
Dec 11, 2008
Solar Link to 50% of Warming During the Past 100 Years
By Paul Biggs, Climate Research News
There is a new paper ‘in press’ in Geophysical Research Letters by Eichler et al entitled, ‘Temperature response in the Altai region lags solar forcing’.The Abstract states:
The role of the sun on Earth’s climate variability is still much debated. Here we present an ice core oxygen isotope record from the continental Siberian Altai, serving as a high-resolution temperature proxy for the last 750 years. The strong correlation between reconstructed temperature and solar activity suggests solar forcing as a main driver for temperature variations during the period 1250-1850 in this region. The precisely dated record allowed for the identification of a 10-30 year lag between solar forcing and temperature response, underlining the importance of indirect sun-climate mechanisms involving ocean induced changes in atmospheric circulation. Solar contribution to temperature change became less important during industrial period 1850-2000 in the Altai region.
In the Results and Discussion the authors write: “Our reconstructed temperatures are significantly correlated with the 10Be and 14C based solar activity reconstructions in the period 1250-1850, but not with the greenhouse gas CO2. This indicates that solar activity changes are a main driver for the temperature variation in the Altai region during the pre industrial time. However, during the industrial period (1850-2000) solar forcing became less important and only the CO2 concentrations show a significant correlation with the temperature record. Our results are in agreement with studies based on NH temperature reconstructions [Scafetta et al., 2007] revealing that only up to approximately 50% of the observed global warming in the last 100 years can be explained by the Sun.”

Whilst this paper supports studies by Scafetta et al, it is clear that solar factors are still poorly understood, and there are many factors other than CO2 or Solar involved in climate change. A correlation with post industrial CO2 does not necessarily imply causation. For example, Tsonis et al, 2007 investigated the collective behavior of known climate cycles such as the Pacific Decadal Oscillation, the North Atlantic Oscillation, the El Nino/Southern Oscillation, and the North Pacific Oscillation. By studying the last 100 years of these cycles’ patterns, they found that the systems synchronized several times. In cases where the synchronous state was followed by an increase in the coupling strength among the cycles, the synchronous state was destroyed. Then, a new climate state emerged, associated with global temperature changes and El Nino/Southern Oscillation variability. The suggestion is that this mechanism explains all global temperature tendency changes and El Nino variability in the 20th century. See post here.
|
|
|
|

