
|
Nov 10, 2008
The Sun Shows Signs of Life—Sort Of
By David Hathaway, NASA
After two-plus years of few sunspots, even fewer solar flares, and a generally eerie calm, the sun is finally showing signs of life. “I think solar minimum is behind us,” says sunspot forecaster David Hathaway of the NASA Marshall Space Flight Center.
His statement is prompted by an October flurry of sunspots. “Last month we counted five sunspot groups,” he says. That may not sound like much, but in a year with record-low numbers of sunspots and long stretches of utter spotlessness, five is significant. “This represents a real increase in solar activity.”
New-cycle sunspot group 1007 emerges on Halloween and marches across the face of the sun over a four-day period in early November 2008. Credit: the Solar and Heliospheric Observatory (SOHO). See larger image here
Even more significant is the fact that four of the five sunspot groups belonged to Solar Cycle 24, the long-awaited next installment of the sun’s 11-year solar cycle. “October was the first time we’ve seen sunspots from new Solar Cycle 24 outnumbering spots from old Solar Cycle 23. It’s a good sign that the new cycle is taking off.” Old Solar Cycle 23 peaked in 2000 and has since decayed to low levels. Meanwhile, new Solar Cycle 24 has struggled to get started. 2008 is a year of overlap with both cycles weakly active at the same time. From January to September, the sun produced a total of 22 sunspot groups; 82% of them belonged to old Cycle 23. October added five more; but this time 80% belonged to Cycle 24. The tables have turned.
At first glance, old- and new-cycle sunspots look the same, but they are not. To tell the difference, solar physicists check two things: a sunspot’s heliographic latitude and its magnetic polarity. (1) New-cycle sunspots always appear at high latitude, while old-cycle spots cluster around the sun’s equator. (2) The magnetic polarity of new-cycle spots is reversed compared to old-cycle spots. Four of October’s five sunspot groups satisfied these two criteria for membership in Solar Cycle 24.
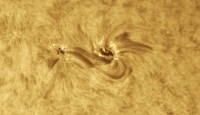
The biggest of the new-cycle spots emerged at the end of the month on Halloween. Numbered 1007, or “double-oh seven” for short, the sunspot had two dark cores each wider than Earth connected by active magnetic filaments thousands of kilometers long. Amateur astronomer Alan Friedman took this picture from his backyard observatory in Buffalo, New York:
On Nov. 3rd and again on Nov. 4th, double-oh seven unleashed a series of B-class solar flares. Although B-flares are considered minor, the explosions made themselves felt on Earth. X-rays bathed the dayside of our planet and sent waves of ionization rippling through the atmosphere over Europe. Hams monitoring VLF radio beacons noticed strange “fades” and “surges” caused by the sudden ionospheric disturbances.
Hathaway tamps down the excitement: “We’re still years away from solar maximum and, in the meantime, the sun is going to have some more quiet stretches.” Even with its flurry of sunspots, the October sun was mostly blank, with zero sunspots on 20 of the month’s 31 days. But it’s a start.
See more here.
Icecap Note: This was less bullish than the release from late 2006 when Hathway first announced the arrival of cycle 24.
Nov 07, 2008
Sunlight Has More Powerful Influence on Ocean Circulation and Climate than North American Ice Sheets
Physorg.com
A study reported in today’s issue of Nature disputes a longstanding picture of how ice sheets influence ocean circulation during glacial periods. The distribution of sunlight, rather than the size of North American ice sheets, is the key variable in changes in the North Atlantic deep-water formation during the last four glacial cycles, according to the article. The new study goes back 425,000 years, according to Lorraine Lisiecki, first author and assistant professor in the Department of Earth Science at the University of California, Santa Barbara.
Lisiecki and her co-authors studied 24 separate locations in the Atlantic by analyzing information from ocean sediment cores. By observing the properties of the shells of tiny marine organisms, called foraminifera, found in these cores, they were able to deduce information about the North Atlantic deep water formation. Scientists can discern historical ocean temperature and circulation patterns through the analysis of the chemical composition of these marine animals.
Previously, scientists relied on a study called “Specmap,” performed in 1992, to find out how different parts of the climate system interacted with one another during glacial cycles. Specmap analyzed ocean circulation at only one place in the Atlantic. “What I found was that the one site that the Specmap study used actually didn’t match most of the other sites in the Atlantic,” said Lisiecki. “They just happened to have a strange site that didn’t behave like most of the other sites. The other sites show that the circulation is not responding to the ice volume, but that it is responding to changes in the distribution of sunlight.”
Previously, scientists believed that deep ocean circulation, the amount of water formed in the North Atlantic that goes into the deep ocean, varied or responded according to the amount of ice volume in the Northern Hemisphere. The prevailing idea was that when ice ages occur, with large sheets of ice over North America, the amount of North Atlantic deep water is reduced. That’s an important part of circulation,” said Lisiecki. “The Gulf Stream brings up warm water from the tropics and that water is turned into this North Atlantic deep water that then sinks and moves southward at depth so you have a cycle. Warm water moves northward and then cools and sinks. That’s the North Atlantic deep water formation process.”
When warm water in the Gulf Stream comes north, it brings heat to the North Atlantic and Europe and then sinks in the North Atlantic and flows back southward at a depth of 3,000 meters. “This is fairly important for the climate because it brings this heat northward,” said Lisiecki. “The Specmap study in 1992 found that circulation is reduced when you have large ice sheets, presumably because you have less of this North Atlantic deep water forming. Our results show that this is not always true.”
She explained that the new data changes our understanding about how the different parts of the climate system are interacting with one another and in particular the influence of the ice sheets on climate. “Because the ice sheets are so large, it was a nice simple story to say that they were having the predominant influence on all the parts of the climate system,” said Lisiecki. “But our study showed that this wasn’t the only important part of the changes in climate. The distribution of sunlight is the controlling factor for North Atlantic deep water formation.
Nov 07, 2008
Hard Lesson about Solar Realities for NOAA / NASA
By Warwick Hughes with input from David Archibald
The real world sunspot data remaining quiet month after month are mocking the curved red predictions of NOAA and about to slide underneath. Time for a rethink I reckon NOAA !! Here is my clearer chart showing the misfit between NOAA /NASA prediction and real-world data. Regular readers might remember that we started posting articles drawing attention to contrasting predictions for Solar Cycle 24, way back on 16 December 2006. Then in March 2007 I posted David Archibald’s pdf article, ”The Past and Future of Climate”. I would like to see another version of David’s Fig 12 showing where we are now in the transition from Cycle 23 to Cycle 24. Solar Cycle 24 Prediction Issued April 2007 from NOAA /NASA.
See larger image here
David provided several new graphics. The first compares Solar Cycle 23 to the minima of the late 20th century and the late 19th and early 20th century. Note the similarity to the older cycles in the current cycle.

See larger image here
David has a bit of fun with this graphic which is aligned on the previous solar minimum. Solar Cycles 3 and 4 prior to the Dalton Minimum had very similar shapes and amplitudes to Solar Cycles 22 and 23.
See larger image here
See the full post and all the graphics here.
Nov 06, 2008
Winter’s Chill Comes Early as Fairbanks Records Fourth-Coldest October, High Plains Hit by Blizzard
By Tim Mowry, Newsminer
FAIRBANKS - One of the coldest Octobers on record in the Interior has the Yukon River grinding to a halt and residents settling in for winter. October 2008 went down as Fairbanks’ fourth-coldest October on record since 1904, according to meteorologist Rick Thoman with the National Weather Service in Fairbanks. The average temperature of 15.1 degrees was 8.4 degrees below normal.
The coldest October on record in Fairbanks was in 1996, which had an average temperature of 13.1 degrees. “That year we had three days in a row with lows in the mid 20s below,” Thoman recalled. “We didn’t have anything quite like that this year. “It was just persistently below-normal temperatures rather than some great cold outbreak,” he said. “There were no records set.” The low temperature for the month at Fairbanks International Airport, the weather services official measuring station in Fairbanks, was 13 below - recorded on Oct. 29 and well shy of Octobers record low: 28 below, set on Oct. 27, 1935.
There were 13 days when the low temperature was zero or colder, the most sub-zero days in October since 1965, which holds the record of 14 sub-zero days in October and ranks as the second-coldest October on record. “The number of days below zero was notable,” Thoman said. Only two days during the month saw temperatures above normal, the result of a chinook that blew into the Interior from the Gulf of Alaska on Oct. 10-11 and pushed temperatures into the high 40s before dropping again. Had it not been for the chinook, this October likely would have made the top three coldest Octobers on record, Thoman said. The warm blast of air also prevented Fairbanks from having one of its earliest snowpacks on record by melting about 4 inches of snow that had fallen the week before, Thoman said. As it was, the snowpack was established on Oct. 13. Total snowfall for the month was 12.2 inches, which is just slightly above normal.
The colder weather froze Interior lakes quicker and deeper than usual, but rivers are still in the process of freezing solid, said Larry Rundquist at the National River Forecast Center in Anchorage. The ice on the Yukon River has stopped moving in several Interior villages, including Circle, Galena, Tanana and Nulato, Rundquist reported. The ice on the Tanana River at Manley stopped running on Oct. 23, he said. The early part of winter has been much colder this year than normal in terms of “freezing degree days,” which Rundquist said are the driver for freeze-up and ice thickness. Freezing degree days are accumulated when the average daily temperature drops below 32 degrees. One freezing degree day is the equivalent of one degree below freezing. For example, if the average daily temperature is 22 degrees, it equals 10 freezing degree days. Fairbanks accumulated 600 freezing degree days in October this year, compared to an average of 260, Rundquist said.
In the Interior village of Eagle, on the Yukon River near the Canadian border, the coldest temperature in October was 24 below, said resident John Borg, who reports temperatures to the National Weather Service. The Yukon River ice hasn’t frozen completely yet, but it won’t be long, Borg said. “The ice isn’t packed in shoulder to shoulder yet,” he said by phone on Monday. “It’s got a ways to go yet. I’d say a minimum of two weeks unless we get some severe cold weather.” Most of the 150 or so residents in the town at the end of the 160-mile Taylor Highway have settled in for the winter, he said. The road, which isn’t maintained in the winter, is pretty much impassable at this point, he said. “Most everybody planning to be here for the winter is on this side of the summit,” he said, referring to 3,650-foot American Summit. See story here. Contact staff writer Tim Mowry at 459-7587.

Also in the lower 48 states, the USAToday reported the season’s first major blizzard pounded the Dakotas and parts of Wyoming and Nebraska Thursday with wind gusts approaching 80 mph. Schools were shut down, highways closed and power was knocked out across the region. Wind gusts of 78 mph were reported in Rapid City, S.D., and 38.5 inches of snow had fallen on nearby Deadwood, S.D., according to a blizzard warning issued by the National Weather Service. In Wyoming, Chester Hejde, 78, said the storm is close to the worst he’s seen in his lifetime. “A neighbor drove over here and he says he didn’t know where he was, and he’s lived here all his life,” said Hejde, who operates the Bunkhouse Bed and Breakfast about 20 miles northeast of Sundance, Wyo. “We’re just socked in here.”
Nov 03, 2008
Sea Level at Kakadu
By John McLean
Kakadu National Park is regarded as one of Australia’s iconic parks because of its flora, fauna, landforms and history. It is often claimed that this park is under threat from rising sea level so this discussion looks at what is known about sea level in the region. The park has about 100km of coastline fronting Van Diemen Gulf, which is basically a large bay with narrow entrances to the north (Dundas Strait) and the west (Clarence Strait). The East Alligator River and the South Alligator River, along with the smaller West Alligator River and Wildman River drain fresh water from the park into the Gulf.
It is claimed that the natural levees near the mouths of these rivers are as little as 20cm above water level and could easily be breached by rising sea level, which would cause salt water intrusion into fresh water systems.
What was found: Sea level at Darwin and Milner Bay has a regular cycle of higher sea in summer (Dec-Feb) and lower sea in winter (June-August).
See larger image here
For these two locations sea level varies synchronously and in accordance with the state of the ENSO system, rising as the SOI moves in a positive direction (i.e. towards La Nina) and falling as the SOI moves in a negative direction (towards El Nino). It therefore follows that sea level at previous times of strong La Nina conditions might have topped the natural levees of the freshwater rivers especially if the La Nina conditions existed across the summer period of high seas. These two conditions were met across 1975-6 with the month average SOI values of 19.5, 11.8 and 12.9 from December 1975 to February 1976, so the levees may have been breached on that occasion. In the archive of SOI values we find 13 other December-February periods of positive SOI values and similar breaches may have occurred at that time.
It is also noted that sea level at Darwin since 1998 is lower than the general relationship with the SOI suggests. (If the line for SOI is raised to match the line for sea level in the pre-1997 period then after 1997 the line for SOI will be above the line for sea level.) The reasons for this are not clear but it does suggest that sea level is rising less than might be expected. The 12-month running average of sea level at Darwin matches that at Milner Bay quite well so it seems unlikely that there was a sudden change in the height of the tidal guage.
See larger image here
Read full analysis here.
|
|
|
|

