Mar 10, 2009
It’s the Sun, Stupid!
By Dr. Willie Soon
The theory that climate change is chiefly caused by solar influences “is no longer tenable,” says US National Academy of Sciences president Ralph Cicerone. Carbon dioxide, he argues, is the key driver of recent climate change. I beg to differ. The amount and distribution of solar energy that we receive varies as the Earth revolves around the Sun and also in response to changes in the Sun’s activity. Scientists have now been studying solar influences on climate for 5000 years.
Chinese imperial astronomers kept detailed sunspot records. They noticed that more sunspots meant warmer weather on Earth. In 1801, the celebrated astronomer William Herschel noticed that when there were few spots, the price of wheat soared - because, he surmised, less “light and heat” from the Sun resulted in reduced harvests.
Is it true then that solar radiation, which supplies Earth with the energy that drives our climate, and caused so many climate shifts over the ages, is no longer the principal influence on climate change? The UN’s climate panel claims there is scientific “consensus” that man-made CO2 emissions are causing “dangerous” climate change. However, its 2007 Climate Assessment is fraught with serious scientific shortcomings in its discussion of the Sun’s influence on Earth’s climate.
The most recent scientific evidence shows that even small changes in solar radiation have a strong effect on Earth’s temperature and climate. In 2005, I demonstrated a surprisingly strong correlation between solar radiation and temperatures in the Arctic over the past 130 years. Since then, I have demonstrated similar correlations in all the regions surrounding the Arctic, including the US mainland and China. The close relationships between the abrupt ups and downs of solar activity and of temperature that I have identified occur locally in coastal Greenland; regionally in the Arctic Pacific and north Atlantic; and hemispherically for the whole circum-Arctic, suggesting that changes in solar activity drive Arctic and perhaps even global climate.
There is no such match between the steady rise in atmospheric CO2 concentration and the often dramatic ups and downs of surface temperatures in and around the Arctic. I recently discovered direct evidence that changes in solar activity have influenced what has been called the “conveyor-belt” circulation of the great Atlantic Ocean currents over the past 240 years. For instance, solar-driven changes in temperature, and in the volume of freshwater output from the Arctic, cause variations in sea surface temperature in the tropical Atlantic 5-20 years later.
These previously undocumented results have been published in the journal Physical Geography. They make it difficult to maintain that changes in solar activity play an insignificant role in climate change, especially over the Arctic. The hallmark of good science is the testing of a plausible hypothesis that is then either supported or rejected by the evidence. The evidence in my paper is consistent with the hypothesis that the Sun causes climatic change in
the Arctic. It invalidates the hypothesis that CO2 is a major cause of observed climate change - and raises serious questions about the wisdom of imposing cap-and-trade or other policies that would cripple energy production and economic activity, in the name of “preventing catastrophic climate change.”
Bill Clinton used to sum up politics by saying, “It’s the economy, stupid!” Now we can fairly sum up climate change by saying, “It’s the Sun, stupid!”
Willie Soon is a solar and climate scientist at the Harvard-Smithsonian Center for Astrophysics. This is his personal opinion based upon 18 years of scientific research
Mar 04, 2009
Global Warming May Stop for Years or Decades
By Justin Berk, The Examiner
The past two snowy winters for the nation may become more common. Has this late winter storm left you scratching your head about global warming? This winter itself has proven to be cold and snowy for most of the US, including many southern locations (Las Vegas, New Orleans, Houston, and Hawaii). The snow finally arrived in the Mid Atlantic, albeit late in the season. The irony of five inches of snow still did not stop the Global Warming protest in DC on Monday, but the onslaught of new research may hinder others.
Michael Reilly posted an article in Discovery News that is getting a lot of internet traffic, as well it should. It brings up the possibility that warming of the planet will not resume. First, Reilly cites a new study in Geophysical Research Letters which suggests that global warming might stop for up to 30 years. Wait, in the 1970s, there was fear of an impending ice age. Newsweek published The Cooling World in 1975. Since then, the planet has warmed for, uh, about 30 years!
Just last week I reported that 2008 was the coolest year for the planet since 2000. You can see the related slide show below. One climate expert tried to argue against it, which put the spotlight on inconsistent data. There is a debate now just on the accuracy of data. Arctic sea ice measurements were just discovered to be flawed and were missing ice the size of California due to a faulty sensor. Even Denver Weather Examiner, Tony Hake, discussed how moving the weather station to the new airport has disrupted their records. Can we even trust the data we are getting now?
Reilly asked Kyle Swanson of the University of Wisconsin-Milwaukee about some recent warming: “How does this square with temperature records from 2005-2007, by some measurements among the warmest years on record?” When added up with the other four years since 2001, Swanson said the overall trend is flat, even though temperatures should have gone up by 0.2 degrees Centigrade (0.36 degrees Fahrenheit) during that time.
As a scientist, I have been hesitant about the runaway warming train for one main reason: Feedback Mechanisms. Regardless of my belief in the natural cycles and variability, Earth has a way of balancing out extremes. For example, melting arctic ice would in turn cool the ocean and add fresh water that forces warmer salt water to sink, suppressing a heat source. Another feedback that is not fully understood is the result of warming on clouds. Will the atmosphere fill with more clouds since warmer temperatures will lead to more evaporation? In that case, more rain would be a cooling feedback. This was seen by Dr. Roy Spenser (former NASA climatologist), who was a pioneer in climate modeling. His initial data did not include precipitation, and the IPCC ran with those numbers. When he included precipitation and corrected his numbers, a lot of the expected warming disappeared.
Reilly’s article suggests that this could be part of the natural system: “It is possible that a fraction of the most recent rapid warming since the 1970s was due to a free variation in climate,” Isaac Held of the National Oceanic and Atmospheric Administration in Princeton, New Jersey wrote in an email to Discovery News. “Suggesting that the warming might possibly slow down or even stagnate for a few years before rapid warming commences again.” Okay, so we have to wait for perhaps another 30 years to see more warming? Doesn’t this contradict the letter from James Hansen (and Al Gore) to President Obama stating that we only have 4 years left before the point of no return? Or will the number of years actually increase with the next report? That does seem to be the trend. Back on April 30th, the US Senate Committee on Environment and Public Works stated: The UK Telegraph reports on April 30: “Global warming will stop until at least 2015 because of natural variations in the climate, scientists have said. Researchers studying long-term changes in sea temperatures said they now expect a “lull” for up to a decade while natural variations in climate cancel out the increases caused by man-made greenhouse gas emissions.
More scientists and more research continue to support that the Global Warming Theory has some flaws. The fire media reports may have been overdone. However, the barrage of attacks against those of us that care to share some of this information is getting worse. Roger Pilke, Jr. wrote on his blog Prometheus:One climate scientist suggests that my calling out Al Gore for misrepresenting the science of disasters and climate change (as well as Andy Revkin’s comparison of that to George Will’s misrepresentations) to be morally comparable to killing 1,000 people. It sounds a lot like Dr. Heidi Cullen (The Weather Channel’s former Climate Code) telling Larry King in 2007 that degreed meteorologists who don’t promote Global Warming awareness should lose their certification. It also sounds like the Catholic Church imprisoning Galileo for promoting heliocentrism. At that time, the accepted public view was that Earth was the center of the universe. Speaking out against it, even with scientific proof, was subject to imprisonment or even death. Scary....Read post here.
Mar 03, 2009
Global Warming On Hold
By Michael Reilly, Discovery News
For those who have endured this winter’s frigid temperatures and today’s heavy snowstorm in the Northeast, the concept of global warming may seem, well, almost wishful. But climate is known to be variable—a cold winter, or a few strung together doesn’t mean the planet is cooling. Still, according to a new study, global warming may have hit a speed bump and could go into hiding for decades.
Earth’s climate continues to confound scientists. Following a 30-year trend of warming, global temperatures have flatlined since 2001 despite rising greenhouse gas concentrations, and a heat surplus that should have cranked up the planetary thermostat.
For those who have endured this winter’s frigid temperatures and today’s heavy snowstorm in the Northeast, the concept of global warming may seem, well, almost wishful. But climate is known to be variable—a cold winter, or a few strung together doesn’t mean the planet is cooling. Still, according to a new study, global warming may have hit a speed bump and could go into hiding for decades.
Earth’s climate continues to confound scientists. Following a 30-year trend of warming, global temperatures have flatlined since 2001 despite rising greenhouse gas concentrations, and a heat surplus that should have cranked up the planetary thermostat. For those who have endured this winter’s frigid temperatures and today’s heavy snowstorm in the Northeast, the concept of global warming may seem, well, almost wishful.
But climate is known to be variable—a cold winter, or a few strung together doesn’t mean the planet is cooling. Still, according to a new study, global warming may have hit a speed bump and could go into hiding for decades. Earth’s climate continues to confound scientists. Following a 30-year trend of warming, global temperatures have flatlined since 2001 despite rising greenhouse gas concentrations, and a heat surplus that should have cranked up the planetary thermostat.
“This is nothing like anything we’ve seen since 1950,” Kyle Swanson of the University of Wisconsin-Milwaukee said. “Cooling events since then had firm causes, like eruptions or large-magnitude La Ninas. This current cooling doesn’t have one.”
Instead, Swanson and colleague Anastasios Tsonis think a series of climate processes have aligned, conspiring to chill the climate. In 1997 and 1998, the tropical Pacific Ocean warmed rapidly in what Swanson called a “super El Nino event.” It sent a shock wave through the oceans and atmosphere, jarring their circulation patterns into unison.
How does this square with temperature records from 2005-2007, by some measurements among the warmest years on record? When added up with the other four years since 2001, Swanson said the overall trend is flat, even though temperatures should have gone up by 0.2 degrees Centigrade (0.36 degrees Fahrenheit) during that time.
The discrepancy gets to the heart of one of the toughest problems in climate science—identifying the difference between natural variability (like the occasional March snowstorm) from human-induced change.
But just what’s causing the cooling is a mystery. Sinking water currents in the north Atlantic Ocean could be sucking heat down into the depths. Or an overabundance of tropical clouds may be reflecting more of the sun’s energy than usual back out into space.
Swanson thinks the trend could continue for up to 30 years. But he warned that it’s just a hiccup, and that humans’ penchant for spewing greenhouse gases will certainly come back to haunt us. “When the climate kicks back out of this state, we’ll have explosive warming,” Swanson said. “Thirty years of greenhouse gas radiative forcing will still be there and then bang, the warming will return and be very aggressive.” Read story here.
See larger image here.
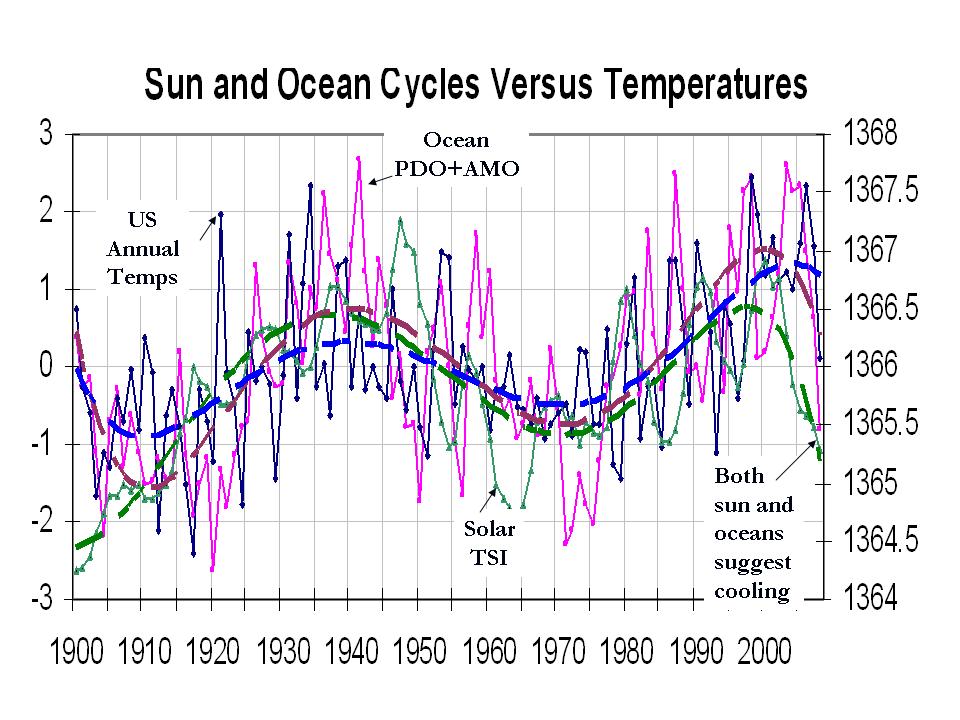
Swanson had it right up to the last paragraph. The warming and cooling relates to the cyclical nature of the oceans (and sun). The Pacific and recently the Atlantic went into strong cooling the last few years, taking surface temperatures down with them. In 30 years, they will bounce back and temperatures will do also. CO2 plays no role.
Mar 01, 2009
Clear Thinking on Global Warming
By Randall Hoven in the American Thinker
Many people write sensible things about anthropogenic global warming, but I find Professor William Happer’s statement to the US Senate on February 25, 2009, especially clear and convincing. Happer is the Cyrus Fogg Bracket Professor of Physics at Princeton University. He was also the Director of Energy Research at DOE from 1990-93, where he supervised all of DOE’s work on climate change.
He says this:"The climate is warming and CO2 is increasing. Doesn’t this prove that CO2 is causing global warming through the greenhouse effect? No, the current warming period began about 1800 at the end of the little ice age, long before there was an appreciable increase of CO2. There have been similar and even larger warmings several times in the 10,000 years since the end of the last ice age. These earlier warmings clearly had nothing to do with the combustion of fossil fuels. The current warming also seems to be due mostly to natural causes, not to increasing levels of carbon dioxide. Over the past ten years there has been no global warming, and in fact a slight cooling. This is not at all what was predicted by the IPCC models.
“He explains the “bit player” role that CO2 plays in greenhouse warming. Even if doubled, CO2 in the atmosphere would increase global temperatures “on the order of one degree,” all else equal, and that would be about as much as it could ever increase it. He explains that not all else is equal. He explains that satellite measurements indicate that water vapor and clouds, which account for 90% of greenhouse warming, have a negative feedback with CO2 levels, thus counteracting most or all of the warming effects of CO2. He explains that temperatures have been warmer in the past and undergo cycles, counter to the “hockey stick” graph trumpeted in the third report of the IPCC.
The hockey stick “was the result of incorrect handling of proxy temperature records and incorrect statistical analysis. There really was a little ice age and there really was a medieval warm period that was as warm or warmer than today. I bring up the hockey stick as a particularly clear example that the IPCC summaries for policy makers are not dispassionate statements of the facts of climate change.” He explains how ice core observations show that historical temperatures and CO2 levels are indeed correlated, but that temperature increases preceded the CO2 increases - by “about 800 years”, thus indicating that warming causes increased CO2 and not vice versa.
He explains how erroneous computer models are."It is true that climate models use increasingly capable and increasingly expensive computers. But their predictions have not been very good. For example, none of them predicted the lack of warming that we have experienced during the past ten years. All the models assume the water feedback is positive, while satellite observations suggest that the feedback is zero or negative.”
On sea level rise, “The sea level is indeed rising, just as it has for the past 20,000 years since the end of the last ice age. Fairly accurate measurements of sea level have been available since about 1800. These measurements show no sign of any acceleration."He explains that CO2, and higher concentrations of it in the atmosphere, are actually good for us. “Crop yields will continue to increase as CO2 levels go up, moderate warming is an overall benefit to mankind because of higher agricultural yields and many other reasons.”
And finally, he shoots down the supposed “scientific consensus” on global warming. For one, consensus is not the way science works. And two, there is no consensus.His statement is truly scientific. Not because he is a credentialed scientist, but because he uses physical observations to support or falsify hypotheses. Unlike so many other statements on climate change (e.g., any statement from Al Gore or NASA’s James Hansen), you can follow his reasoning and it makes sense.Keep his testimony in your hip pocket, for the next time you are called a “denier.” Read story here. Read Happer’s submitted testimony here.
Feb 27, 2009
Climate Science in A Tornado
By George Will, Washington Post
Icecap Note: Before reading George’s rebuttal, see this right on Watts Up with That perspective. Here is George’s Post.
Few phenomena generate as much heat as disputes about current orthodoxies concerning global warming. This column recently reported and commented on some developments pertinent to the debate about whether global warming is occurring and what can and should be done. That column, which expressed skepticism about some emphatic proclamations by the alarmed, took a stroll down memory lane, through the debris of 1970s predictions about the near certainty of calamitous global cooling.
Concerning those predictions, the New York Times was—as it is today in a contrary crusade—a megaphone for the alarmed, as when (May 21, 1975) it reported that “a major cooling of the climate” was “widely considered inevitable” because it was “well established” that the Northern Hemisphere’s climate “has been getting cooler since about 1950.” Now the Times, a trumpet that never sounds retreat in today’s war against warming, has afforded this column an opportunity to revisit another facet of this subject—meretricious journalism in the service of dubious certitudes.
On Wednesday, the Times carried a “news analysis”—a story in the paper’s news section, but one that was not just reporting news—accusing Al Gore and this columnist of inaccuracies. Gore can speak for himself. So can this columnist.

Reporter Andrew Revkin’s story was headlined: “In Debate on Climate Change, Exaggeration Is a Common Pitfall.” Regarding exaggeration, the Times knows whereof it speaks, especially when it revisits, if it ever does, its reporting on the global cooling scare of the 1970s, and its reporting and editorializing—sometimes a distinction without a difference—concerning today’s climate controversies.
Which returns us to Revkin. In a story ostensibly about journalism, he simply asserts—how does he know this?—that the last decade, which passed without warming, was just “a pause in warming.” His attempt to contact this writer was an e-mail sent at 5:47 p.m., a few hours before the Times began printing his story, which was not so time-sensitive—it concerned controversies already many days running—that it had to appear the next day. But Revkin reported that “experts said” this columnist’s intervention in the climate debate was “riddled with” inaccuracies. Revkin’s supposed experts might exist and might have expertise but they do not have names that Revkin wished to divulge. As for the anonymous scientists’ unspecified claims about the column’s supposedly myriad inaccuracies: The column contained many factual assertions but only one has been challenged. The challenge is mistaken.
Citing data from the University of Illinois’ Arctic Climate Research Center, as interpreted on Jan. 1 by Daily Tech, a technology and science news blog, the column said that since September “the increase in sea ice has been the fastest change, either up or down, since 1979, when satellite record-keeping began.” According to the center, global sea ice levels at the end of 2008 were “near or slightly lower than” those of 1979. The center generally does not make its statistics available, but in a Jan. 12 statement the center confirmed that global sea ice levels were within a difference of less than 3 percent of the 1980 level.
So the column accurately reported what the center had reported. But on Feb. 15, the Sunday the column appeared, the center, then receiving many e-mail inquiries, issued a statement saying “we do not know where George Will is getting his information.” The answer was: From the center, via Daily Tech. Consult the center’s Web site where, on Jan. 12, the center posted the confirmation of the data that this column subsequently reported accurately.
The scientists at the Illinois center offer their statistics with responsible caveats germane to margins of error in measurements and precise seasonal comparisons of year-on-year estimates of global sea ice. Nowadays, however, scientists often find themselves enveloped in furies triggered by any expression of skepticism about the global warming consensus (which will prevail until a diametrically different consensus comes along; see the 1970s) in the media-environmental complex. Concerning which:
On Feb. 18 the U.S. National Snow and Ice Data Center reported that from early January until the middle of this month, a defective performance by satellite monitors that measure sea ice caused an underestimation of the extent of Arctic sea ice by 193,000 square miles, which is approximately the size of California. The Times ("All the news that’s fit to print"), which as of this writing had not printed that story, should unleash Revkin and his unnamed experts.
Read story here.
|

