Videos from Tony Heller and Dr. Richard Keen as an Intro:
Anthony Watts:
From But Now You Know. There is most certainly a pattern to climate change...but it’s not what you may think:
For at least 114 120 years, climate “scientists” have been claiming that the climate was going to kill us...but they have kept switching whether it was a coming ice age, or global warming.
(A timeline of claims follows, updated to 2014)
1895 - Geologists Think the World May Be Frozen Up Again - New York Times, February 1895
1902 - “Disappearing Glaciers...deteriorating slowly, with a persistency that means their final annihilation...scientific fact...surely disappearing.” - Los Angeles Times
1912 - Prof. Schmidt Warns Us of an Encroaching Ice Age - New York Times, October 1912
1923 - “Scientist says Arctic ice will wipe out Canada: - Professor Gregory of Yale University, American representative to the Pan-Pacific Science Congress, - Chicago Tribune
1923 - “The discoveries of changes in the sun’s heat and the southward advance of glaciers in recent years have given rise to conjectures of the possible advent of a new ice age"- Washington Post
1924 - MacMillan Reports Signs of New Ice Age - New York Times, Sept 18, 1924
1929 - “Most geologists think the world is growing warmer, and that it will continue to get warmer” - Los Angeles Times, in Is another ice age coming?
1932 - “If these things be true, it is evident, therefore that we must be just teetering on an ice age” - The Atlantic magazine, This Cold, Cold World
1933 - America in Longest Warm Spell Since 1776; Temperature Line Records a 25-Year Rise - New York Times, March 27th, 1933
1933 - “...wide-spread and persistent tendency toward warmer weather...Is our climate changing?” - Federal Weather Bureau “Monthly Weather Review.”
1938 - Global warming, caused by man heating the planet with carbon dioxide, “is likely to prove beneficial to mankind in several ways, besides the provision of heat and power.” - Quarterly Journal of the Royal Meteorological Society
1938 - “Experts puzzle over 20 year mercury rise...Chicago is in the front rank of thousands of cities throughout the world which have been affected by a mysterious trend toward warmer climate in the last two decades” - Chicago Tribune
1939 - “Gaffers who claim that winters were harder when they were boys are quite right...weather men have no doubt that the world at least for the time being is growing warmer” - Washington Post
1952 - “...we have learned that the world has been getting warmer in the last half century” - New York Times, August 10th, 1962
1954 - “winters are getting milder, summers drier. Glaciers are receding, deserts growing” - U.S. News and World Report
1954 - Climate - the Heat May Be Off - Fortune Magazine
1959 - “Arctic Findings in Particular Support Theory of Rising Global Temperatures” - New York Times
1969 - “...the Arctic pack ice is thinning and that the ocean at the North Pole may become an open sea within a decade or two” - New York Times, February 20th, 1969
1969 - “If I were a gambler, I would take even money that England will not exist in the year 2000” - Paul Ehrlich (while he now predicts doom from global warming, this quote only gets honorable mention, as he was talking about his crazy fear of overpopulation)
1970 - “...get a good grip on your long johns, cold weather haters - the worst may be yet to come...there’s no relief in sigh” - Washington Post
1974 - Global cooling for the past forty years - Time Magazine
1974 - “Climatological Cassandras are becoming increasingly apprehensive, for the weather aberrations they are studying may be the harbinger of another ice age” - Washington Post
1974 - “As for the present cooling trend a number of leading climatologists have concluded that it is very bad news indeed” - Fortune magazine, who won a Science Writing Award from the American Institute of Physics for its analysis of the danger
1974 - “...the facts of the present climate change are such that the most optimistic experts would assign near certainty to major crop failure...mass deaths by starvation, and probably anarchy and violence” - New York Times
Cassandras are becoming increasingly apprehensive, for the weather aberrations they are studying may be the harbinger of another ice age
1975 - Scientists Ponder Why World’s Climate is Changing; A Major Cooling Widely Considered to Be Inevitable - New York Times, May 21st, 1975
1975 - “The threat of a new ice age must now stand alongside nuclear war as a likely source of wholesale death and misery for mankind” Nigel Calder, editor, New Scientist magazine, in an article in International Wildlife Magazine
1976 - “Even U.S. farms may be hit by cooling trend” - U.S. News and World Report
1981 - Global Warming - “of an almost unprecedented magnitude” - New York Times
1988 - I would like to draw three main conclusions. Number one, the earth is warmer in 1988 than at any time in the history of instrumental measurements. Number two, the global warming is now large enough that we can ascribe with a high degree of confidence a cause and effect relationship to the greenhouse effect. And number three, our computer climate simulations indicate that the greenhouse effect is already large enough to begin to effect the probability of extreme events such as summer heat waves. - Jim Hansen, June 1988 testimony before Congress, see His later quote and His superior’s objection for context
1989 - “On the one hand, as scientists we are ethically bound to the scientific method, in effect promising to tell the truth, the whole truth, and nothing but which means that we must include all doubts, the caveats, the ifs, ands and buts. On the other hand, we are not just scientists but human beings as well. And like most people we’d like to see the world a better place, which in this context translates into our working to reduce the risk of potentially disastrous climate change. To do that we need to get some broad based support, to capture the public’s imagination. That, of course, means getting loads of media coverage. So we have to offer up scary scenarios, make simplified, dramatic statements, and make little mention of any doubts we might have. This “double ethical bind” we frequently find ourselves in cannot be solved by any formula. Each of us has to decide what the right balance is between being effective and being honest. I hope that means being both.” - Stephen Schneider, lead author of the Intergovernmental Panel on Climate Change, Discover magazine, October 1989
1990 - “We’ve got to ride the global warming issue. Even if the theory of global warming is wrong, we will be doing the right thing - in terms of economic policy and environmental policy” - Senator Timothy Wirth
1993 - “Global climate change may alter temperature and rainfall patterns, many scientists fear, with uncertain consequences for agriculture.” - U.S. News and World Report
1998 - No matter if the science [of global warming] is all phony ...climate change [provides] the greatest opportunity to bring about justice and equality in the world.” - Christine Stewart, Canadian Minister of the Environment, Calgary Herald, 1998
2001 - “Scientists no longer doubt that global warming is happening, and almost nobody questions the fact that humans are at least partly responsible.” - Time Magazine, Monday, Apr. 09, 2001
2003 - Emphasis on extreme scenarios may have been appropriate at one time, when the public and decision-makers were relatively unaware of the global warming issue, and energy sources such as “synfuels,” shale oil and tar sands were receiving strong consideration” - Jim Hansen, NASA Global Warming activist, Can we defuse The Global Warming Time Bomb?, 2003
2006 - “I believe it is appropriate to have an over-representation of factual presentations on how dangerous it is, as a predicate for opening up the audience to listen to what the solutions are, and how hopeful it is that we are going to solve this crisis.” - Al Gore, Grist magazine, May 2006
2006 - “It is not a debate over whether the earth has been warming over the past century. The earth is always warming or cooling, at least a few tenths of a degree...” - Richard S. Lindzen, the Alfred P. Sloan professor of meteorology at MIT
2006 - “What we have fundamentally forgotten is simple primary school science. Climate always changes. It is always...warming or cooling, it’s never stable. And if it were stable, it would actually be interesting scientifically because it would be the first time for four and a half billion years.” -Philip Stott, emeritus professor of bio-geography at the University of London
2006 - “Since 1895, the media has alternated between global cooling and warming scares during four separate and sometimes overlapping time periods. From 1895 until the 1930’s the media peddled a coming ice age. From the late 1920’s until the 1960’s they warned of global warming. From the 1950’s until the 1970’s they warned us again of a coming ice age. This makes modern global warming the fourth estate’s fourth attempt to promote opposing climate change fears during the last 100 years.” - Senator James Inhofe, Monday, September 25, 2006
2007 - “I gave a talk recently (on fallacies of global warming) and three members of the Canadian government, the environmental cabinet, came up afterwards and said, ‘We agree with you, but it’s not worth our jobs to say anything.’ So what’s being created is a huge industry with billions of dollars of government money and people’s jobs dependent on it.” - Dr. Tim Ball, Coast-to-Coast, Feb 6, 2007
2008 - “Hansen was never muzzled even though he violated NASA’s official agency position on climate forecasting (i.e., we did not know enough to forecast climate change or mankind’s effect on it). Hansen thus embarrassed NASA by coming out with his claims of global warming in 1988 in his testimony before Congress” - Dr. John S. Theon, retired Chief of the Climate Processes Research Program at NASA, see above for Hansen quotes
Section updated by Anthony Watts:
2009 - Climate change: melting ice will trigger wave of natural disasters. Scientists at a London conference next week will warn of earthquakes, avalanches and volcanic eruptions as the atmosphere heats up and geology is altered. Even Britain could face being struck by tsunamis - “Not only are the oceans and atmosphere conspiring against us, bringing baking temperatures, more powerful storms and floods, but the crust beneath our feet seems likely to join in too,” - Professor Bill McGuire, director of the Benfield Hazard Research Centre, at University College London, - The Guardian, Sep 2009.
2010 - What Global Warming Looks Like. It was more than 5C (about 10F) warmer than climatology in the eastern European region including Moscow. There was an area in eastern Asia that was similarly unusually hot. The eastern part of the United States was unusually warm, although not to the degree of the hot spots in Eurasia. James Hansen - NASA GISS, August 11, 2010.
2011 - Where Did Global Warming Go? “In Washington, ‘climate change’ has become a lightning rod, it’s a four-letter word,” said Andrew J. Hoffman, director of the University of Michigan’s Erb Institute for Sustainable Development. - New York Times, Oct 15, 2011.
2012 - Global warming close to becoming irreversible-scientists. “This is the critical decade. If we don’t get the curves turned around this decade we will cross those lines,” said Will Steffen, executive director of the Australian National University’s climate change institute, speaking at a conference in London. Reuters, Mar 26, 2012
2013 - Global-warming ‘proof’ is evaporating. The 2013 hurricane season just ended as one of the five quietest years since 1960. But don’t expect anyone who pointed to last year’s hurricanes as “proof” of the need to act against global warming to apologize; the warmists don’t work that way. New York Post, Dec 5, 2013
2014 - Climate change: It’s even worse than we thought. Five years ago, the last report of the Intergovernmental Panel on Climate Change painted a gloomy picture of our planet’s future. As climate scientists gather evidence for the next report, due in 2014, Michael Le Page gives seven reasons why things are looking even grimmer. - New Scientist (undated in 2014)
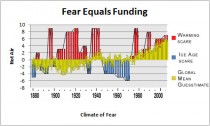
The actual Global Warming Advocates’ chart, overlaid on the “climate change” hysterics of the past 120 years. Not only is it clear that they take any change and claim it’s going to go on forever and kill everyone, but notice that they even sometimes get the short-term trend wrong…
Worse still, notice that in 1933 they claim global warming has been going on for 25 years...the entire 25 years they were saying we were entering an ice age. And in 1974, they say there has been global cooling for 40 years...the entire time of which they’d been claiming the earth was getting hotter! Of course NOW they are talking about the earth “warming for the past century”, again ignoring that they spent much of that century claiming we were entering an ice age.
The fact is that the mean temperature of the planet is, and should be, always wavering up or down, a bit, because this is a natural world, not a climate-controlled office.
See also:
150 Years of Global Warming and Cooling at the New York Times
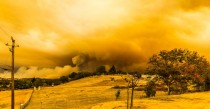
It’s tragic issues with wildfires the last two years are the result of radical governmental and environmental policies/inaction. The people in the path of these fast moving infernos and the brave firefighters trying to save lives and property are suffering because of bad state government and greed by large NGOs.
CA Gov. Jerry Brown Vetoed Bipartisan Wildfire Management Bill in 2016
Last year, as all Hell was breaking loose in California as residents were burned out of their homes, neighborhoods and businesses, Gov. Jerry Brown was jetting around the world spouting climate change propaganda, and calling this California’s ‘new normal.’
“With climate change, some scientists are saying Southern California is literally burning up, and burning up as maybe a metaphor or a description not just to the fires right here, but what we can expect over the next years and decades,” Brown said.
RELATED:
Nov. 13, 2018 - CA Gov. Jerry Brown Vetoed 2016 Wildfire Management Bill While CA Burned
Aug. 12, 2018- California Wildfires Caused By Radical Environmentalists, Not Climate Change
Aug. 6, 2018 - California burns: The “new normal” thanks to Obama Era Environmental Regulations
Aug. 9, 2018 - CA Gov. Jerry Brown Vetoed Bipartisan Wildfire Management Bill in 2016
July 9, 2018- Jerry Brown’s California: Socialist, Climate-Conscious Open Borders Utopia
Today, as California burns once again under torrential wildfires, many Californians have been asking why the dramatic increase in wildfires in the last five years… that is everyone except Governor Jerry Brown. Governor Brown claims that year-round, devastating fires are the “new normal” we must accept.
Megan Barth and I reported Monday:
“Supporting Obama-era regulations have resulted in the new normal: an endless and devastating fire season. Obama-era regulations introduced excessive layers of bureaucracy that blocked proper forest management and increased environmentalist litigation and cost - a result of far too many radical environmentalists, bureaucrats, Leftist politicians and judicial activists who would rather let forests burn, than let anyone thin out overgrown trees or let professional loggers harvest usable timber left from beetle infestation, or selectively cut timber.”
Mismanaged, overcrowded forests provide fuel to historic California wildfires, experts say. The 129 million dead trees throughout California’s forests are serving as matchsticks and kindling.
Jerry Brown, busy mulling ways to prevent the end of the world, took the Clinton and Obama-era gross regulations a step even further when he vetoed a bipartisan wildfire management bill in 2016.
At the request of the City Council of Laguna Beach, Sen. John Moorlach (R-Costa Mesa), authored SB 1463 in 2016, a bipartisan bill which would have given local governments more say in fire-prevention efforts through the Public Utilities Commission proceeding making maps of fire hazard areas around utility lines.
California fires produced as much pollution in 2 days as all the state’s cars do in a year
Laguna Beach went through four fires sparked by utility lines in the last ten years, and has done as much in the way of prevention as they could afford. The bill would have allowed cities to work with utilities to underground utility lines, and work with the Public Utilities Commission to develop updated fire maps by requiring the PUC to take into consideration areas in which communities are at risk from the consequences of wildfire, not just those areas where certain environmental hazards are present.
Moorlach’s bill came about when on February 2, 2016, the PUC served the final version of Fire Map 1, and the City of Laguna Beach was not placed within the low-risk margins of the Utility Fire Threat Index.
Gov. Brown vetoed SB 1463, despite being passed by the Legislature, 75-0 in the Assembly and 39-0 in the Senate. That tells you this was political. The Governor’s veto message did not properly address why he vetoed the bill. Brown claimed that the PUC and CalFire have already been doing what Moorlach’s bill sought to accomplish. How on earth could Brown kill this bill when the state was burning down?
“SB 1463 would have not only safeguarded Laguna and other high fire-risk communities in Orange County, but would have helped other vulnerable communities throughout the state that are often threatened by wildfires caused by sparks from shorted or fallen utility lines,” Sen. Moorlach said in a statement following the surprise veto. “The Governor’s veto impedes the necessity to more urgently address the California Public Utilities Commission’s focus on identifying high risk areas that should be prioritized for appropriate mitigation measures.”
California fires produced as much pollution in 2 days as all the state’s cars do in a year.
After SB 1463 was killed by Gov. Brown, Sen. Moorlach and his brilliant staff had an epiphany: Redirect the state’s accumulated cap-and-trade funds into wildfire prevention.
Authored in 2018, the new Senate Bill 1463, aptly named “Cap and Trees,” would continuously appropriate 25 percent of state cap-and-trade funds to counties to harden the state’s utility infrastructure and better manage wildlands and our overgrown and drought-weakened forests, Moorlach recently wrote in a San Francisco Chronicle op ed.
The idea was to actually reduce the state’s highest source of greenhouse gas emissions, curb the impacts of future wildfires and prevent unnecessary damage to life and property, the new SB 1463 fact sheet reported.
However, SB 1463 was killed in the radical Senate Environmental Quality Committee by Democrats, even though there was no opposition to it. The killing was purely political, with no regard given to the people of the state.
Cap and Trade was a scheme born out of the California Global Warming Solutions Act of 2006, known as AB 32, which charged the California Air Resources Board with lowering greenhouse gas emissions to 1990 levels by 2020. In addition, AB 32 requires the ARB to inventory GHG emissions in California, and approve statewide GHG emissions limits.
Sen. Moorlach’s second version of SB 1463 would also have required the California Air Resources Board to include greenhouse gas emissions from wildland and forest fires in their updated Scoping Plan. The ARB does not actually track GHGs - they just estimate. The ARB is extorting millions of dollars from California businesses on their best guesses.
It is estimated that “for every 2 to 3 days these wildfires burn, GHG emissions are roughly equal to the annual emissions from every car in the entire state of California,”
USA Today/Reno Gazette reported in 2017. Last year, there were more than 9,000 major wildfires which burned over 1.2 million acres. Several of the large fires were caused or exacerbated by sparking utility lines.
The problem is that the Air Resources Board Scoping Plan ignores the most egregious of all GHG emission problems - manmade wildfires. Instead, the ARB spends a substantial amount of cap and trade funds on high-speed rail, which literally increases GHG emissions and eliminates large carbon sinks. The ARB has a history of diverting funds to pet projects and programs that have little or nothing to do with actually reducing GHG emissions.
The Senate Environmental Quality Committee, responsible for killing Moorlach’s SB 1463, has a radical environmentalist/preservationist as the committee consultant. In the only bill analysis done on SB 1463, this is the drivel she wrote:
“...natural disasters that emit GHGs (such as wildfires) occurred before climate change, will continue to occur as the climate continues to change, and will persist even if mankind ultimately solves the problem of climate change.”
“While science can now conclusively attribute individual extreme events to climate change, it is important to distinguish that extreme events like the recent wildfires in California are a symptom of climate change, not the cause.”
“The overwhelming consensus of climate scientists is that climate change is anthropogenic, meaning human activity has caused the rising GHG concentrations in the atmosphere and, therefore, increasing average global temperatures and the extreme events climate change causes.”
“To include GHG emissions from natural disasters in the state’s inventory that tracks progress towards California’s climate goals, even ones that are made worse by climate change, betrays the fundamental scientific understanding that human activity is responsible for climate change.” (Her emphasis, not mine) 04/19/18- Senate Environmental Quality
Jerry Brown’s Exploitation of California Events
“There is no hope for the truth when world leaders like Governor Brown of California (he runs the 19th largest economy in the world) can present such utterly false information in pursuit of a political agenda,”
“Since civilization emerged 10,000 years ago, we haven’t had this kind of heat condition, and it’s going to continue getting worse and that’s the way it is.” - Jerry Brown
Jerry Brown’s Real Legacy
Remember when Gov. Jerry Brown said the world needs ‘brain washing’ on climate change. Sounding indeed brainwashed, Brown said, “The problem… is us. It’s our whole way of life. It’s our comfort… It’s the greed. It’s the indulgence. It’s the pattern. And it’s the inertia.”
Brown screeched in 2015 that California has an overpopulation problem, and the ongoing drought was proof that the explosion of population in California has reached the limit of what the states’ resources can provide. “We are altering this planet with this incredible power of science, technology and economic advance,” Brown told the publisher of the Los Angeles Times. “If California is going to have 50 million people, they’re not going to live the same way the native people lived, much less the way people do today...You have to find a more elegant way of relating to material things. You have to use them with greater sensitivity and sophistication.”
Brown has managed to divert the fawning, slobbering California media away from his actual responsibilities as California Governor, and instead has them focused on hysteria, doom, gloom, and intangibles like “climate change.”
---------------------
Marc Morano and Craig Rucker add:
California’s wildfires are a horrific tragedy. At last report 63 people are dead, 631 missing and 11,862 structures have been destroyed. We hold those lost and suffering in our thoughts and prayers.
Not unexpectedly, Governor Jerry Brown would have us believe the harm caused by California’s wildfires is the result of climate change. But that is false.
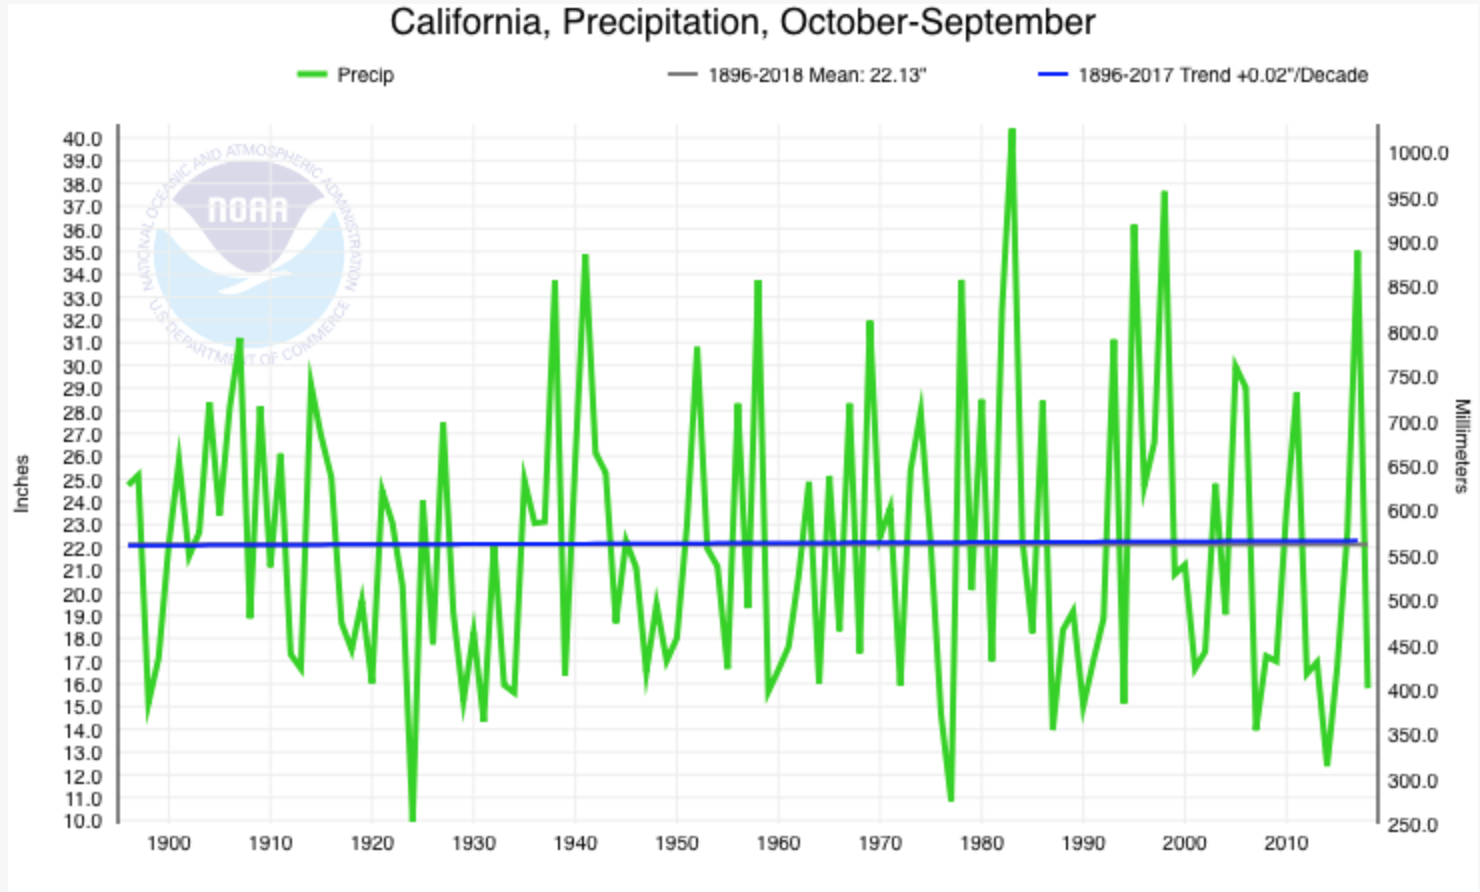
As CFACT’s Marc Morano explains through extensive coverage at Climate Depot, California’s rain and drought are historically normal. In fact, the total U.S. acreage burned by wildfires is actually down in recent years.
That said, there are anthropogenic roots to this catastrophe. But they are not the human causal links Governor Brown points to.
Rapid population growth, extensive development, poor water management, and most critically, irresponsible forest management are principally to blame.
Green activists blocked forest clearing in the name of species protection, leaving California with 129 million dead trees, clogging 8.9 million acres.
If government actually wanted to promote the rapid and uncontrolled spread of deadly wildfires, it would be hard-pressed to find a better approach. Once again the Greens find themselves on the wrong side of the implacable law of unintended consequences, as the very species they profess to care about, are incinerated before our eyes.
Governor Brown, if you are still searching for the anthropogenic link to California’s tragic fires, I expect somewhere in the governor’s mansion there’s probably be a mirror.
---------
California Gov. Brown Shirks Blame for Devastating Wildfires
Liberal California Gov. Jerry Brown has never been one to take personal responsibility. He has made a career out of blaming others for his and the failures of extreme left-wing policies.
It comes as no surprise that just one day after Pres. Donald J. Trump criticized the state for the gross forestry mismanagement linked to surging wildfires, Gov. Brown was quick to blame climate change and climate deniers.
“Managing all the forests in everywhere we can does not stop climate change. And those who deny that are definitely contributing to the tragedies that we’re now witnessing, and will continue to witness in the coming years,” Brown reportedly said. “We’re fighting nature with the amount of material we’re putting in the environment, and that material traps heat, and the heat fosters fires, and the fires keep burning.”
But it’s an inconvenient truth that Gov. Brown and his merry band of West Coast liberals have imposed radical environmental regulations that run contrary to appropriate forest management.
Pres. Trump has cited the Democrat laws designed to protect species such as the Spotted Owl that effectively ended the ability of loggers to clear-cut swaths of forests. Clear-cutting acted as a deterrent to wildfires spreading over vast areas because it cut off the fuel supply.
Under Pres. Clinton, old-growth trees were protected from logging and that effectively ended the timber industry’s ability to clear-cut in 1994. More far-left policies also ended grazing by cattle and other farmers.
“(Prior to 1994) mostly fuels were removed through logging, active management - which they stopped - and grazing,” Bob Zybach, a reforestation consultant with a Ph.D. in environmental science, reportedly said. “You take away logging, grazing, and maintenance, and you get firebombs.”
While these policies may have been well-intentioned, Democrats pushed through solutions that caused much greater problems. Now, those habitats and species they sought to protect are completely destroyed, thousands of Californians have been displaced and the death toll continues to rise.
In 2005, the Western Governors Association released a report that warned such policies would have dire consequences.
“Over time the fire-prone forests that were not thinned, burn in uncharacteristically destructive wildfires, and the resulting loss of forest carbon is much greater than would occur if the forest had been thinned before fire moved through,” the WGA reportedly stated. “In the long term, leaving forests overgrown and prone to unnaturally destructive wildfires means there will be significantly less biomass on the ground, and more greenhouse gases in the atmosphere.”
But these mostly Republican governors from cattle and farmland states were dismissed and no fact-based actions were taken to restore logging as an effective means of forest management.
But perhaps the larger problem with regards to wildfires is that the left-leaning media appears ready to come to Gov. Brown’s defense even while liberal journalists know he is dead wrong. A prime example is the New York Times that is changing its tune after they criticized the end of clear-cutting in 2012.
“The U.S. Forest Service estimates that more than 190 million acres of public land are at risk of catastrophic fires, including 60 percent our national forests. Too many trees, too much brush, and bureaucratic regulations and lawsuits filed by environmental extremists are to blame,” The New York Times stated in 2012. “Timber harvests have plunged more than 75 percent from 12 billion board feet per year to less than 4 billion board feet per year. The result: historically large ponderosa pines which grew in stands of 20 to 55 trees per acre now grow (and burn) in densities of 300 to 900 trees per acre.”
At the time the article was published, the NY Times stated that wildfire devastation escalated from 81,043 fires burning 1,329,704 acres in 1998 to 74,126 fires burning 8,711,367 acres in 2011. The NY Times attributed the incredible uptick in lost habitats to the failed policies started by Clinton and pushed further by radical liberals.
These days, the NY Times is simply trying to support any claim by any Democrat because the failed newspaper has zero interest in fact-based reporting. Rather than stand by its claims made six years ago, the NY Times trolls out a liberal writer to make an odd claim that Pres. Trump is somehow incorrect. A recent piece misleads by pointing readers to forest thinning rather than clear-cutting. Dead brush and twigs may be the root cause of a wildfire, but stopping a wildfire means cutting off its fuel supply. That fuel is trees, particularly pine trees.
“Researchers are attributing at least part of the difference to climate change because in a warming world vegetation dries out faster and burns more easily,” NY Times writer Kendra Pierre-Louis states.
The NY Times writer goes on to try and shift blame to the federal government, claiming the state of California doesn’t own much of the impacted land. Either naive or just “dishonest,” as the president often says of the publication, the regulations apply to state and federal agencies alike.
Liberals ended the most effective tool to stop wildfires - clear cutting - and bog down anyone who tries to take precautionary measures through proper forest management. Perhaps Interior Secretary Ryan Zinke said it best.
“Every year we watch our forests burn, and every year there is a call for action,” Sec. Zinke reportedly said. “Yet, when action comes, and we try to thin forests of dead and dying timber, or we try to sustainably harvest timber from dense and fire-prone areas, we are attacked with frivolous litigation from radical environmentalists who would rather see forests and communities burn than see a logger in the woods.”
-----------
More and more people have left the squalor of the sanctuary cities and high property costs and taxes and move to beautiful wooded areas they put themselves in greater danger given the eco fanatics control.
The Global Warming Policy Foundation Dr. Richard Lindzen
Over half a century ago, C.P. Snow (a novelist and English physical chemist who also served in several important positions in the British Civil Service and briefly in the UK government) famously examined the implications of ‘two cultures’:
A good many times I have been present at gatherings of people who, by the standards of the traditional culture, are thought highly educated and who have with considerable gusto been expressing their incredulity at the illiteracy of scientists.
Once or twice I have been provoked and have asked the company how many of them could describe the Second Law of Thermodynamics. The response was cold: it was also negative. Yet I was asking something which is the scientific equivalent of: Have you read a work of Shakespeare’s?
I now believe that if I had asked an even simpler question - such as, What do you mean by mass, or acceleration, which is the scientific equivalent of saying, Can you read? - not more than one in ten of the highly educated would have felt that I was speaking the same language. So the great edifice of modern physics goes up, and the majority of the cleverest people in the western world have about as much insight into it as their Neolithic ancestors would have had.
I fear that little has changed since Snow’s assessment 60 years ago. While some might maintain that ignorance of physics does not impact political ability, it most certainly impacts the ability of non-scientific politicians to deal with nominally science-based issues. The gap in understanding is also an invitation to malicious exploitation. Given the democratic necessity for non-scientists to take positions on scientific problems, belief and faith inevitably replace understanding, though trivially oversimplified false narratives serve to reassure the non-scientists that they are not totally without scientific ‘understanding.’ The issue of global warming offers numerous examples of all of this.
I would like to begin this lecture with an attempt to force the scientists in the audience to come to grips with the actual nature of the climate system, and to help the motivated non-scientists in this audience who may be in Snow’s ‘one in ten’ to move beyond the trivial oversimplifications.
At the heart of this nonsense is the failure to distinguish weather from climate. Thus, global warming refers to the welcome increase in temperature of about 1C since the end of the Little Ice Age about 200 years ago. On the other hand, weather extremes involve temperature changes of the order of 20C. Such large changes have a profoundly different origin from global warming. Crudely speaking, they result from winds carrying warm and cold air from distant regions that are very warm or very cold. These winds are in the form of waves.
The strength of these waves depends on the temperature difference between the tropics and the Arctic (with larger differences leading to stronger waves). Now, the models used to project global warming all predict that this temperature difference will decrease rather than increase. Thus, the increase in temperature extremes would best support the idea of global cooling rather than global warming. However, scientifically illiterate people seem incapable of distinguishing global warming of climate from temperature extremes due to weather.
In fact, as has already been noted, there doesn’t really seem to be any discernible trend in weather extremes. There is only the greater attention paid by the media to weather, and the exploitation of this ‘news’ coverage by people who realize that projections of catastrophe in the distant future are hardly compelling, and that they therefore need a way to convince the public that the danger is immediate, even if it isn’t. This has also been the case with sea-level rise. Sea level has been increasing by about 8 inches per century for hundreds of years, and we have clearly been able to deal with it.
In order to promote fear, however, those models that predict much larger increases are invoked. As a practical matter, it has long been known that at most coastal locations, changes in sea level, as measured by tide gauges, are primarily due to changes in land level associated with both tectonics and land use.
Moreover, the small change in global mean temperature (actually the change in temperature increase) is much smaller than what the computer models used by the IPCC have predicted. Even if all this change were due to man, it would be most consistent with low sensitivity to added carbon dioxide, and the IPCC only claims that most (not all) of the warming over the past 60 years is due to man’s activities. Thus, the issue of man-made climate change does not appear to be a serious problem.
However, this hardly stops ignorant politicians from declaring that the IPCC’s claim of attribution is tantamount to unambiguous proof of coming disaster.
--------
Cherry picking is always an issue. Thus, there has been a recent claim that Greenland ice discharge has increased, and that warming will make it worse. Omitted from the report is the finding by both NOAA and the Danish Meteorological Institute that the ice mass of Greenland has actually been increasing. In fact both these observations can be true, and, indeed, ice build-up pushes peripheral ice into the sea. Misrepresentation, exaggeration, cherry picking, or outright lying pretty much covers all the so-called evidence.
Conclusion
So there you have it. An implausible conjecture backed by false evidence and repeated incessantly has become politically correct ‘knowledge,’ and is used to promote the overturn of industrial civilization. What we will be leaving our grandchildren is not a planet damaged by industrial progress, but a record of unfathomable silliness as well as a landscape degraded by rusting wind farms and decaying solar panel arrays. False claims about 97% agreement will not spare us, but the willingness of scientists to keep mum is likely to much reduce trust. in and support for science. Perhaps this won’t be such a bad thing after all - certainly as concerns ‘official’ science.
There is at least one positive aspect to the present situation. None of the proposed policies will have much impact on greenhouse gases. Thus we will continue to benefit from the one thing that can be clearly attributed to elevated carbon dioxide: namely, its effective role as a plant fertilizer, and reducer of the drought vulnerability of plants. Meanwhile, the IPCC is claiming that we need to prevent another 0.5C of warming, although the 1C that has occurred so far has been accompanied by the greatest increase in human welfare in history. As we used to say in my childhood home of the Bronx: ‘Go figure’.
One of the most curious aspects of the climate debate is that almost no one insists on mathematically rigorous tests of the major hypotheses that are involved. This is true among the warmists, of course, but is often true among the skeptics as well. Why the skeptics do not do so is beyond me. But most skeptics do not appear to do so. This often takes the form of endorsement of both natural and man-made sources of global warming, often with the view that the skeptics believe the man-made effects are minor. One of many examples is Benny Peiser, the Executive Director of the Global Warming Policy Foundation in London, probably the leading climate skeptic group in Britain. He has done many useful things for the skeptic cause, but endorsing the concept of man-made global warming is not one of them.
Peiser is a social anthropologist - a discipline that may not widely use the relevant rigorous statistical methods in their work. Peiser has stated that climate change is due both to natural and man-made causes. But there is no rigorous evidence for the latter offered by Peiser or anyone else. So why is it advantageous to skeptics to support the opposition for a belief that has not been rigorously supported using the most appropriate mathematical techniques?
This may be crucial to the outcome of the debate here in the US since a legal case can be made that even a minor human effect is sufficient to invoke the Clean Air Act (CAA), assuming that the Act is even applicable to climate as the courts (but not Congress) have ruled. Now the US CAA is not applicable in Britain, so perhaps Peiser can be excused for not understanding the implications in the US, but the result is the same.
However, everyone needs to use the mathematically proper tools that are readily available, particularly in a controversial topic like climate. This is particularly true given the enormous, totally unnecessary costs involved if the current “consensus” on climate science has in fact no rigorous proof of its validity. The principal “evidence” offered by the warmists is not really evidence at all. Their elaborate mathematical climate models prove nothing except that they make a lot of assumptions, and the results reflect the assumptions they have made. Many billions have been wasted on this “research,” perhaps because some people actually believe in this sophisticated nonsense since all General Circulation Models (except the Russians’ get similar results.
The Merits of an Econometric Approach Compared to Climate Models
Regarding the merits of the methodology discussed here versus that used in developing the climate models relied upon in EPA’s Endangerment Finding and in the IPCC publications, a quote from Congressional testimony by Dr. John Christy is useful here:
“The advantage of the simple statistical treatment discussed here is that the complicated processes such as clouds, ocean-atmosphere interaction, aerosols, etc., are implicitly incorporated by the statistical relationships discovered from the actual data. Climate models attempt to calculate these highly non-linear processes from imperfect parameterizations (estimates) whereas the statistical model directly accounts for them since the bulk atmospheric temperature is the response-variable these processes impact. It is true that the statistical model does not know what each sub-process is or how each might interact with other processes. But it also must be made clear: it is an understatement to say that no IPCC climate model accurately incorporates all of the nonlinear processes that affect the system. I simply point out that because the model is constrained by the ultimate response variable (bulk temperature), these highly complex processes are included.
“The fact that this statistical model {typically} explains 75-90 percent of the real annual temperature variability, depending on the data set, using these influences (ENSO, volcanoes, solar) is an indication the statistical model is useful. This result promotes the conclusion that this approach achieves greater scientific (and policy) utility than results from elaborate climate models which on average fail to reproduce the real world’s global average bulk temperature trend since 1979.”
Warmists Like Some Econometric Methods but Not Others
Although the warmists are all for using econometric methods to tease out the smallest possible indication that pollutants (e.g., NOx, XOx, ozone, etc.) cause adverse economic or physical effects, they seem adamantly opposed to using mathematically proper econometric techniques to determine what impact CO2 have had on Earth’s temperatures. The point is that the proper mathematical methods must be used in both types of analyses. And the proper conclusions produced to date are that actual pollutants above various concentration levels can cause adverse medical and economic effects, but the effects have unfortunately sometimes been exaggerated, but that increasing CO2, including human-related emissions, have not resulted in statistically significant increases in temperatures in the real world.
Unfortunately, many climate skeptics have not accepted these econometric findings and continue to rely on general statements that the effects of increasing CO2 concentration levels have only minor effects on temperatures. But from a US legal viewpoint and the Clean Air Act this may turn out to be a critical issue. There is simply no basis for believing that increasing atmospheric CO2 has had any significant effect in the real world on temperatures and skeptics need to raise this point at every opportunity. The issue is not whether there may be theoretical effects of CO2 on temperatures, but rather whether any significant such effects actually occur in the real world. It is important to point out that there is no basis for climate extremism’s basic tenet. They will no doubt be attempts to ignore this fact, but sometime, somewhere, people might actually pay attention to what the science actually says.
-------------
ICECAP NOTE:
Earth’s temperature changes which have cycled predictably in multi-decadal ways shown to change with ocean and solar cycles and volcanism. When these are considered in a rigorous econometric way, they explain all the changes in temperatures in 14 different data sets without any residual - required if CO2 was a driver.
And by the way note, the carbon pollution most warmists talk about (since CO2 is a beneficial gas to all vegetation and crops and humans breathe out 100 times more CO2 than they breathe in.
Poor forest policy is making conflagrations all over California the new norm as forest thinning and logging was halted decades ago.
Blaming climate change for the recent California fires and the state’s water woes appear to be like the kid blaming his dog for eating his homework.
The reality of climate change isn’t the issue. The earth’s climate has warmed and cooled since the beginning of time. Mankind’s impact on climate change remains debatable and laced with hyperbole that does little to solve problems but much to perpetuate political agendas and poor public policy.
Not to be out done, President Trump jumped into the mix recently with a typical tweet that cast the blame on state officials for taking water that otherwise could be used to extinguish fires. While California and the feds seem to be in the business of banning human access to fresh water, that’s not the issue.
Decades ago a hue and cry went out across the U.S. that the timber industry was killing the Northern Spotted Owl, and to end this, logging had to stop. A major California newspaper did a series of stories on logging that used hyperbole and exaggerations, along with some very good photography, to sell this point and win a Pulitzer Prize.
Logging was stopped. Small towns crumbled, and forests became so overgrown that they began to die. Too many trees then competed for a finite amount of water that fell on the forests during the winter months. A northern California rancher once told me that streams and springs he knew as a child dried up because of this competition for water.
This forced deer and elk migrations to change and further changed natural patterns in the forest that exacerbated the problem. Voter-approved ESA-like protections given to the mountain lion didn’t help as the large predators decimate deer herds that once foraged on the forest. We’ve now introduced wolves that will further cause declines in deer and elk populations and force ranchers grazing their cattle on public lands to relocate them.
Stressed trees became fodder for the bark beetle that also killed vast forest vistas. The view from highways connecting places like Susanville and Red Bluff, or Chester and Quincy bear this out. Forest Service policies of squashing just about every lightning-sparked fire compounded the issue as fire has always been a natural part of the forest ecosystem. It is now virtually impossible to have a small, controllable fire anymore.
The consequences of decisions like these are legion, and expensive. Lives and property are lost and destroyed as millions of dollars in fire suppression costs, infrastructure repair and insurance claims are racked up annually because of mankind’s mismanagement of forests.
Public policy is not going to reverse heating and cooling cycles that moved the planet in and out of ice ages. We are likely at the apex of a warm cycle and, according to information I’ve heard, some scientists believe a cyclical change in sunspot patterns may soon move us into a period of cooling.
ICECAP NOTE: Todd is living the story in California. See this rebuttal that supports Todd’s message here.


_thumb.png)
_thumb.png)
_thumb.png)
.png)
.png)
.png)