I live in Bengaluru in southern India. This month, the city recorded the coldest temperature in 10 years for the month of November. So has been the case in my country’s capital, New Delhi, where extreme winters have become a norm in recent years.
A small percentage of India’s 1.3 billion population has access to electrical heaters. However, a majority must burn a variety of fuels for fire to stay warm, making many people susceptible to surprise cold events. Why are cold events considered a surprise and not a normal part of weather? Is it because the public mind has been made complacent about cold by the fearmongering of global warmists?
The reality is cold events have become common not just in India but across the globe. Since 2017, there have been regular incidences of below-average temperatures in both winter and summer. What can be inferred from these cold spells, and what do they suggest about the apocalyptic rhetoric of the climate cult?
The November 18 snow event at Dallas-Fort Worth International Airport is the earliest snowfall in recorded history since 1898. Just an isolated event due to a regional storm? Well, think again.
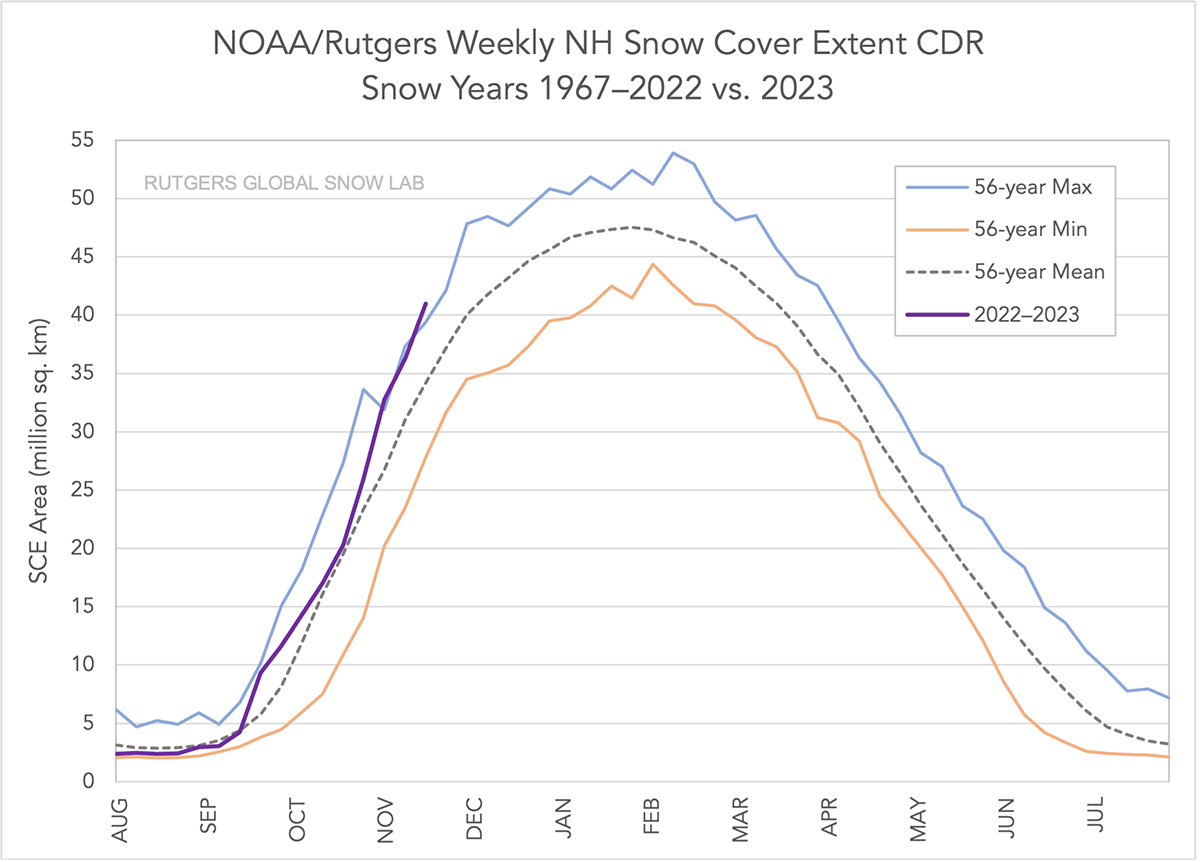
The past few months witnessed unusual cold spells in the U.S. and Canada. Buffalo registered one of its highest snowfalls for November while Vancouver saw unusual early winter snowfall. Northern Hemisphere Snow Accumulation reached record levels.
On November 20 and 21, hundreds of daily all-time low temperature records were registered across the U.S. as Arctic air swept through the North American continent. There have been extreme cold events in other parts of the world too.
In August, China’s northwestern province of Xinjiang experienced surprise summer snowfall. South America, Europe, Asia and Australia registered record low temperatures in recent months.
In Greenland - often a subject in the climate-change debate - the surface mass balance (SMB) of ice sheet this year is at one of its highest levels since 1981 and is set to increase further in the winter season. Greenland has been registering a consistent growth in ice sheet SMB since 2016.
As Electoverse writer Cap Allon notes, “(S)ince 2016, Northern Hemisphere (NH) snow mass seasons have been holding well above the 1982-2012 average, and the 2022-2022 season is proving no different - as of the latest datapoint (Nov 19), the ‘Total snow mass for the NH chart, which comes courtesy of the Finnish Meteorological Institute (FMI), continues to ride above both the multidecadal average and the standard deviation.”
ICECAP NOTE: By Thanksgiving the snow extent was in record territory.
So, do these record snowfall events and record low temperature events mean that there is no increase in global average temperatures? Certainly not! There has been a warming trend since the Little Ice Age began to lose its grip in the 17th century, but never has there been a dangerous general warming - and there is none now.
The claim that global warming has made our summers hotter and winters milder is certainly wrong. As evidenced in the last five years, both extreme cold and extreme warmth have been common.
Until the climate debate took over our media, these thermal ups and downs were known as weather variations. However, in the age of climate apocalypse, every extreme weather event is a catastrophe. Even unusual snowfall and cold are considered sour fruits of man-made emissions of carbon dioxide.
This pseudoscience and outright distortions of media and political elites are harmful. The most vulnerable in our world are more exposed to the risks of cold because of an exaggerated concern about warming.
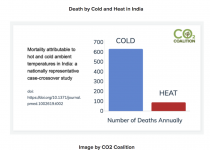
More than 500 million Indians still use open fire to warm themselves while cold kills more people than heat. In some parts of India, winter temperatures can reach as low as -20 Celsius/-4 Fahrenheit. Even in a developed nation such as Germany, climate complacency has led to unpreparedness for winter energy needs and the government officials are now asking citizens to heat just one room in their homes!
It is the cold that kills. If anything, the warming of the past three centuries has been extremely beneficial to mankind, helping us achieve unprecedented progress in human health, living standards, food production and technological achievement as we utilize earth’s resources ever more efficiently.
Vijay Jayaraj is a Research Associate at the CO2 Coalition, Arlington, Virginia. He holds a master’s degree in environmental sciences from the University of East Anglia, UK and resides in India.
Extreme cold records continue to tumble at the South Pole. Three recent days - November 16th, 17th and 18th - have recorded a daily record, with the 18th plunging to -45.2C, compared with -44.7C on the same day in 1987. The records follow the six-month winter of 2020-21, which was the coldest since records began in 1957. Inexplicably, all these facts and trends have escaped reporting in the mainstream media. The excuse might be that it is just weather, and temperatures have always moved up and down. But the excuse doesn’t seem to apply to the July 19th U.K. high of 40.3C at RAF Coningsby, recorded at the side of the runway used by after-burning Typhoon jets. This record high has barely been out of the Net Zero headlines ever since.
In fact, anything getting colder barely gets a look-in these days. Arctic sea ice is making a significant, near silent comeback. Summer ice at the end of September covered 4.92 million square kilometres, which was 1.35 million sq kms higher than the 2012 low. Over on land, the Greenland ice sheet may have increased in size over the last year to August 2022. Meanwhile, the zoologist Dr. Susan Crockford has reported that this is the fifth year out of the last seven that enough sea ice has formed along the west coast of Hudson Bay by mid-November for hunting polar bears to be able to head out to the ice, “just as it did in the 1980s”.
Of course, it has been a very bad year for climate catastrophists all round. Coral is growing on the Great Barrier Reef with a vengeance, just a few years after journalists and their ‘experts’ warned it was likely to disappear. According to the latest satellite data, the global temperature hasn’t moved for over eight years. A little extra carbon dioxide in the atmosphere has led to significant ‘greening’ of the planet, a process that over the last 30 years has undoubtedly reduced world hunger and famine. Sir David Attenborough recently ran a series of six Frozen Planet II green propaganda films featuring a variety of ‘modeled’ climate catastrophes. Notable was the claim that all the Arctic summer sea ice could be gone by 2035. In addition, he highlighted a colony of Adelie penguins in western Antarctica, whose numbers were said to have fallen over 40 years from 20,000 to just 400 breeding pairs, apparently due to climate change. Missing from the narrative was the more cheerful news that a colony of 1.5 million Adelies had recently been discovered on the eastern side of the continent.
Since all the recent poster scares are fast disappearing, there is increasing emphasis on ‘attributing’ single event bad weather to climate change, or to the climate crisis/emergency/breakdown - the new agitprop words used to disguise the fact that global temperatures, with or without CO2’s help, ran out of steam over two decades ago.
Long-serving Guardian activist Fiona Harvey told a recent edition of the BBC Media Show that writers can be impartial and present the facts, and the facts were that ‘scientists’ have told us that we are on a precipice and are facing tipping points that will make the planet uninhabitable. But whose ‘facts’ is she reporting? Again, as the Daily Sceptic has shown, the command-and-control Net Zero agenda is driven by politicized science and often derived from flawed climate models, corrupt surface temperature databases and invented weather ‘attribution’ stories. When the Guardian quotes ‘scientists’, it is often referring to practitioners of observational disciplines such as geography, where modeled ‘impact’ predictions are widely promoted.
In the course of her interview, Harvey repeated the debunked untruth that 30% of Pakistan had been inundated as a result of recent monsoon floods. The actual figure in this mountainous country was easily checked from NASA data and was about 8%. Referring to the general narrative around climate change and the need to keep to 1.5C of warming, she noted that if that didn’t strike you as a story, “you shouldn’t be a journalist”. A better story, of course, might be asking who invented the 1.5C figure in the first place - and why?
Many people such as Harvey state they are journalists, not activists, but the evidence is growing that that pass has long been sold in many areas of mainstream communication and media. Cardiff University sociologist Dr. Aaron Thierry argues that universities should allow academics to spend at least 10% of their time on “advocacy and engagement with policy processes”. In his view, “those with the greatest knowledge and understanding of these crises have a moral obligation to provide leadership and engage in advocacy and activism”.
The Australian geologist Professor Ian Plimer gives short shrift to all the lies and obfuscations surround settled climate science. If it had been proved that human emissions of carbon dioxide drive global warming, ‘“there would be endless citation of the dozen or so seminal scientific papers demonstrating this proof”. Instead, he notes, there is a “deafening silence”. Climate cycles have not changed because humans are alive today, “and cannot be changed by feelings, ideology or legislation”. He also noted: “Bearers of validated facts are denigrated, cancelled and deemed controversial by those who have no counterargument, no ability to critically analyze and who rely on self-interest and feelings.”
Put out in the cold, you might say - just like all those inconvenient South Pole temperature records.
Chris Morrison is the Daily Sceptic’s Environment Editor.
Hurricane Ian hit south Florida on September 28th as a category 4, with 155 mph sustained winds, causing devastating damage throughout the state, billions of dollars of damage, many lives lost, and the usual suspects have all stood up and announced that this was the indisputable result of climate change.
MSNBC anchor Joy Reid said Wednesday - the day hurricane Ian hit, “our earth is getting warmer and there’s just no doubt, I think, left that it[climate change] is feeding these beasts” CNN’s Bill Weir, proclaimed, “This is exactly what climate scientists have been warning about for a long time and now we get to see it up close.”
CNN’s Don Lemon tried to get National Hurricane Center Acting Director Jamie Rohme, to blame the intensity of Hurricane Ian on climate change, when he asked, “What effect has climate change had on this phenomenon that is happening now, because it seems these storms are intensifying that’s the question?” Rohme responded, “I don’t think you can link climate change to any one event.” Lemon then dismissed the expert by saying, “ Okay, well listen, I grew up there and these storms are intensifying something is causing them to intensify.” Lemon arrogantly believes that his personal experiences trump actual science.
Congresswoman Val Demings (D-FL) said we need to “acknowledge climate change and take it extremely seriously.” Senator Amy Klobuchar (D-MN) suggested that Democrat climate policies would prevent hurricanes like Ian in the future when she said, hurricane Ian is “why we’ve got to win this midterm. We just did something about climate change for the first time in decades. That’s why we got to win this[election] as that hurricane bears down on Florida.” Florida Democratic gubernatorial candidate Charlie Christ said, “one factor in all of these [hurricanes] is climate change. These storms are getting bigger, they’re getting stronger, and they’re affecting that many more lives as a result of it.”
We are continually being told that natural disasters like these are the definitive result of climate change. But a hurricane is a weather event. It is not climate. We are reminded of the difference between the two all the time during the winter. Whenever a blizzard hits the Northeast, an arctic blast cripples the Midwest, or Texas is devastated by record colds, we are told that those events are “weather, not climate”, and a weather event is not a reflection of climate change.
In 2019, a polar vortex hit the Midwest United States dropping temperatures to record lows of minus 60 degrees in some areas. When President Donald Trump tweeted, “In the beautiful Midwest, windchill temperatures are reaching minus 60 degrees, the coldest ever record… People can’t last outside even for minutes. What the hell is going on with Global Warming?” The NOAA climate Twitter account immediately shot back with, “Winter storms don’t prove that global warming isn’t happening.”
So, when anybody has the temerity to ask the obvious question, ‘if there is global warming, why are we experiencing record cold temperatures in the winter?’ They are immediately chastised and embarrassed. ‘Weather is different than climate, you idiot. How can you be so stupid to confuse the two?’ One of the reasons why people confuse the two is because the same people who tell us that weather and climate are two different things in the winter, conflate the two in the summer. Every record high temperature anywhere on the planet in the summer is touted as proof that climate change is real, and if everyone doesn’t go out and buy electric cars, solar panels, and windmills, we will all die in five years.
Ironically, after chastising climate skeptics for trying to use extreme winter storms to disprove climate change, climate activists turn right around and try to use them to prove climate change. Princeton University climate scientist Michael Oppenheimer argued that blizzards are proof the planet is warming when he said, climate change will cause a “shorter snow season, less snow overall, but the occasional knockout punch[blizzards].” But I thought we couldn’t use a weather event, especially a winter weather event, as evidence in the climate change debate.
These people need to make up their minds; is a weather event, evidence of the existence of climate change, or is it not? But they will never make up their minds because, for them to prove their narrative, they must continually change the rules of the game. To climate activists, weather is not climate in the winter, but weather is climate in the summer. One of the reasons why I am skeptical of climate change is precisely because of this type of illogical logic that the climate activists are continually spewing. If you want people to believe your theories then be consistent, be honest, and don’t use hyperbole. But sadly, the climate change activists continually violate all three.
On Wednesday, MSNBC Reporter Ali Velshi said, “People say there have been hurricanes for millennia, well that is true but sometimes we get ones that are so much more damaging and so much more intense.” Instead of simply eyeballing it, and deciding in the heat of emotion whether we are getting more hurricanes and more intense hurricanes, why don’t we look at the facts, the actual numbers? Here are statistics of hurricanes over the last 172 years that have hit the mainland United States - directly from the NOAA - National Oceanic and Atmospheric Association.
Year Hurricanes MajorHurricanes
1851-1900 97 27
1901-1950 95 34
1951-2000 72 28
2001-2050(est) 91 32
From 1851 to 1900, 97 hurricanes made landfall in the United States and 27 major hurricanes.
From 1901 to 1950, 95 hurricanes made landfall in the United States and 34 major hurricanes, a decrease of 2 hurricanes, and an increase of 7 major hurricanes.
From 1951 to 2000, 72 hurricanes made landfall in the United States and 28 major hurricanes, a dramatic decrease of 23 hurricanes and a decrease of 6 major hurricanes.
There were substantially more hurricanes and roughly the same number of major hurricanes that hit the United States in the last half of the 19th century when our use of fossil fuels was the lowest than in the last half of the 20th century when our use of fossil fuels was the highest. How could that be? If burning fossil fuels makes the planet warmer, and warming the planet causes more hurricanes and more intense hurricanes, then why were there more hurricanes when we were burning fewer fossil fuels? Why? Can any climate activist explain this? Has anyone even tried? Has anyone even looked at the numbers?
From 2001 to 2022, there have been 40 hurricanes and 14 major hurricanes that have hit mainland United States. If we project those numbers over the first half of the 21st century, we are on pace to have 91 hurricanes and 32 major hurricanes during that time frame which is an increase of 19 hurricanes and 4 major hurricanes from the last half of the 20th century. But that increase would only get us back to hurricane levels we were at 100-150 years ago at the start of the industrial revolution when our use of fossil fuels was at its lowest. We are on pace to have fewer hurricanes and fewer major hurricanes in the first half of the 21st century than we had in the first half of the 20th century when our use of fossil fuels was substantially less.
The numbers are clear. There has not been an increase in the number of hurricanes and the intensity of hurricanes for the 172 years spanning from 1851 to 2022 - from the beginning of the industrial revolution until now. But what is so hard to understand is that these hurricane statistics have been sitting out there in plain sight at NOAA, and no one who has argued that climate change causes an increase in hurricane activity cared to look at them to verify their assertions. The climate change proponents went solely on emotion. A scary, deadly hurricane hit, and their emotional reaction to that event was the only proof they needed to link the two - Climate change is bad; hurricanes are bad; so, they must be connected. This is one of the reasons why there are so many climate change skeptics. If you continually lie to people, people will stop believing what you say. And the climate activists have been dishonest and hyperbolic from the beginning.
In 1989, Noel Brown, director of the New York office of the U.N. Environment Program, predicted that “entire nations could be wiped off the face of the Earth by rising sea levels if the global warming trend is not reversed by the year 2000.”
In his 2006 movie, An Inconvenient Truth, Al Gore claimed that due to climate change humanity had only 10 years left before the world would reach a point of no return. And then in 2009, in a speech at the Copenhagen climate change summit, Gore said, “there is a 75 percent chance that the entire north polar ice cap, during the summer months, could be completely ice-free within five to seven years.”
In 2008, James Hansen, the scientist who first warned the UN of global warming said, we were on a “dangerous level” of greenhouse gases, and “we’re toast if we don’t get on a very different path… this is our last chance.” He then went on to say that the polar ice caps would be ice-free in the summer months in 5-10 years, which is no later than 2018.
And in 2018, congresswoman Alexandria Ocasio-Cortez famously predicted, “The world is gonna end in 12 years if we don’t address climate change.”
All these predictions have been or are about to be proven false. There is just an aura of dishonesty that hangs over the climate change industry. In 2011, the proponents of climate change cleverly changed the name from “global warming” to “climate change” when they saw that the temperatures were not always rising as they predicted. They disguised their theory with the term “climate change” and not the original “global warming” so they could play both sides - when the Earth’s temperature increases, it’s global warming, but when the Earth’s temperature decreases, it’s climate change. And that is another reason why people are skeptical of “climate change” because when you manipulate the language like that people realize that they too are being manipulated.
Climate scientists declare that there is a consensus in the scientific community that humans are causing climate change, but truth is never discovered through consensus. There was a consensus in the scientific community that Covid-19 did not come from a lab; there was a consensus in the intelligence community that Hunter Biden’s laptop was Russian disinformation. And these consensuses have been proven wrong. But climate activists use so-called “scientific consensus” to shut down dissent. Skepticism is not allowed. Everyone must toe the line. Anybody who questions climate science is immediately silenced on social media or mocked and ridiculed into submission. They are trying to win the debate through the mob mentality or herd instinct.
People who deal in the truth welcome debate, embrace questions, and respect skepticism. Those who are lying want to shut down debate, outlaw questions, and vilify skeptics. The climate activists want no debate, no questions. That’s why they always claim, “the science is settled” and “the debate is over”. The proponents of 2+2=4 are not inconsistent; they don’t need to lie; they don’t need to exaggerate, and they welcome debate because they know they are living in the truth. So, climate change proponents if you want people to believe you, then stop acting like liars - stop deceiving, stop manipulating language, and stop strong-arming people. You are destroying the one thing that everyone who wants to be believed needs the most, their credibility.
To be clear, I’m not claiming that global warming does not exist, I am simply saying that until questions like the ones I have posed in this article are answered logically and factually, and the climate activists start being consistent and honest and open to debate, I will always doubt, I will always question, I will always be skeptical. In short, I will act like a scientist, because climate scientists surely are not.
-----------
With RIP on a real climate scientist Dr. Tom Ball, who passed this year at age 82.
Most every area of the mid-latitudes will see summer heat during the high sun angle summer months. Some years the extremes are greater and more persistent. Ocean temperature patterns, solar drivers and local factors including soil moisture, and foehn wind events play a key role in extreme temperatures in summer.
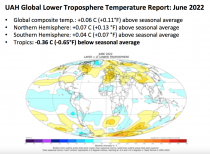
The summer this year June started out on the cool side in many areas including the tropics which averaged -0.65F colder than the 30 year average as measured by satellites. Some warmth was starting to show in the south central U.S and western Europe.
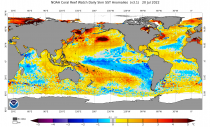
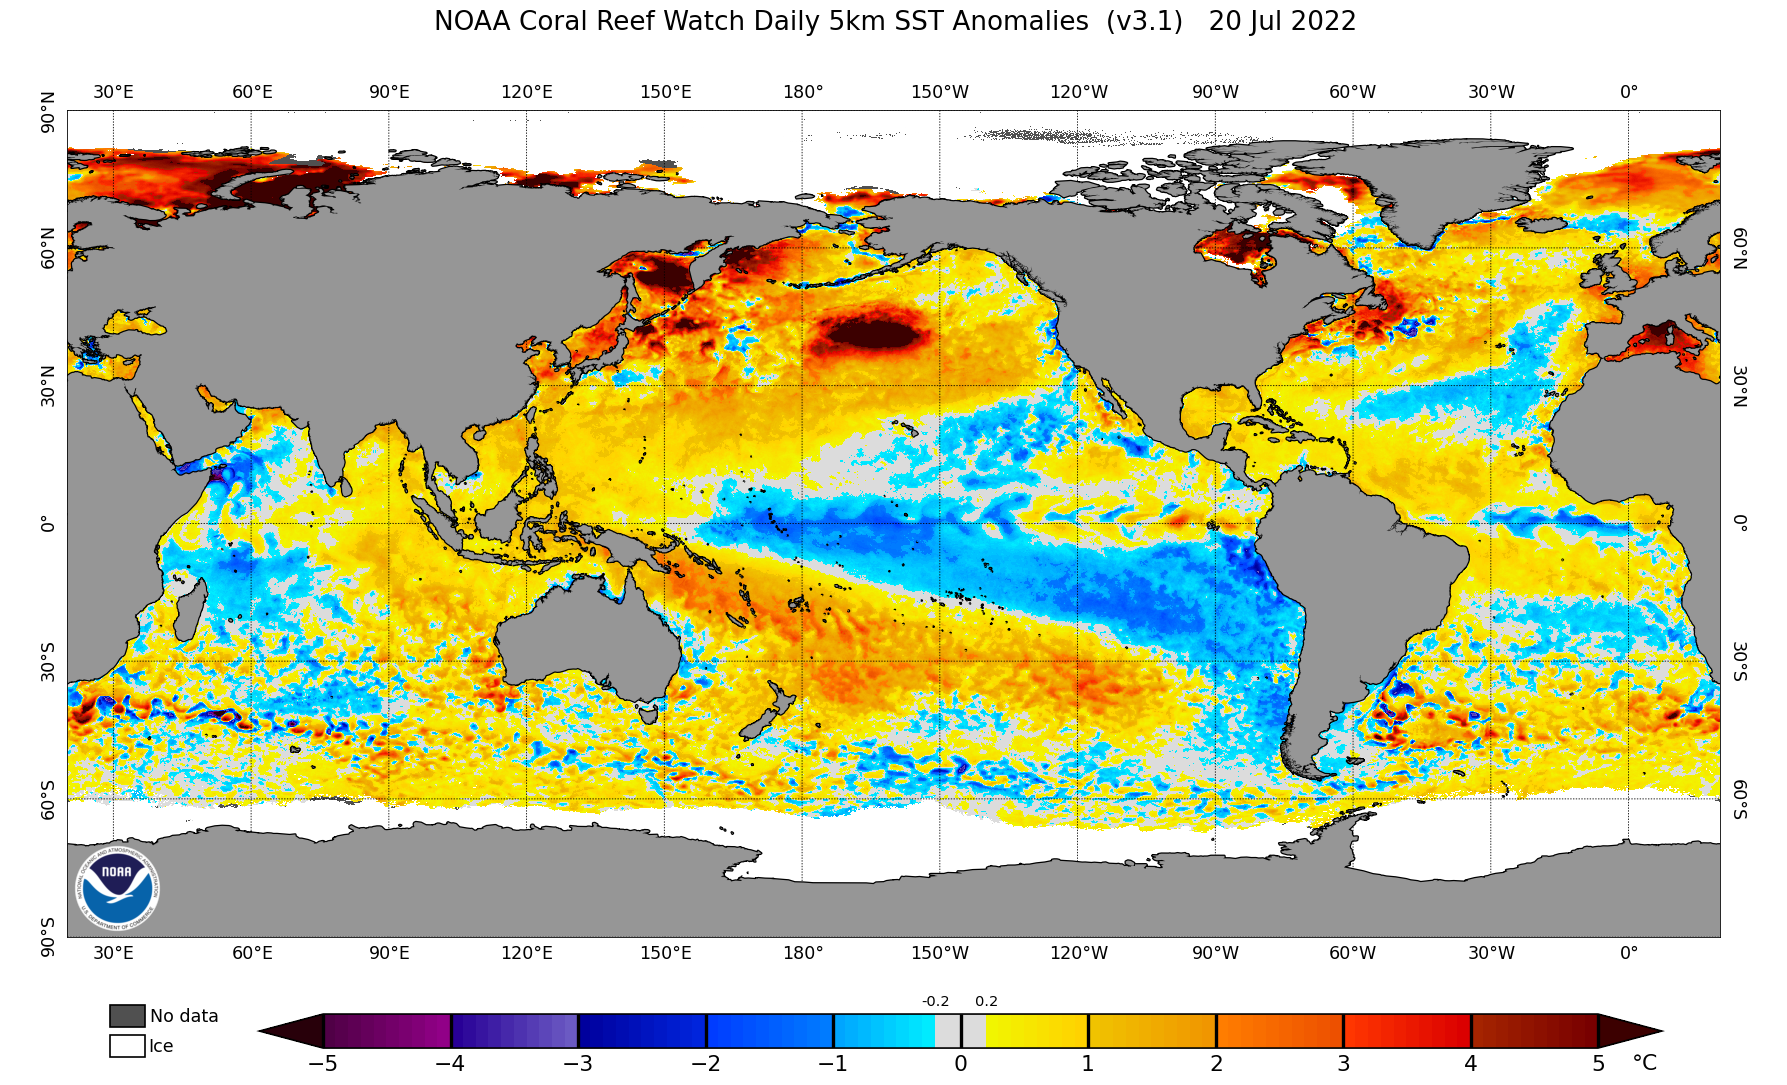
We are in the third year of ‘La Nina’. It is the strongest year of the event. Strong La Ninas have historically been hot and dry in the central states into the east. They produce more tornadoes in the spring and when the Atlantic is warm, more landfalling hurricanes in the east.
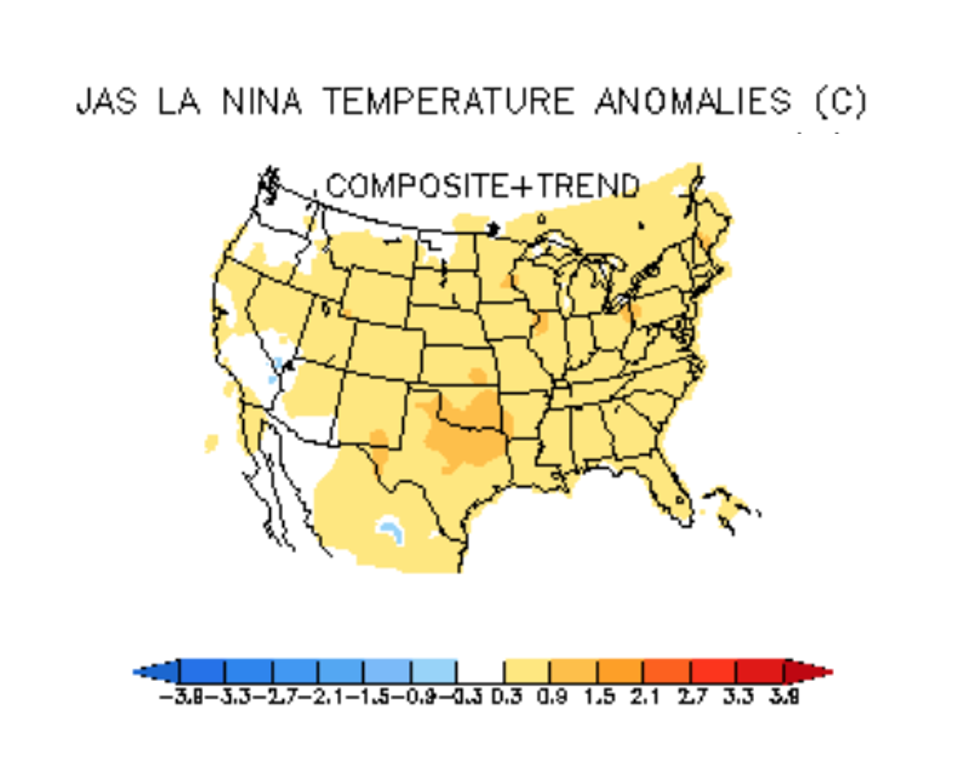
Indeed, the heat is augmented where the springs and early summers are drier than normal. The July to September mean temperature anomalies for La Ninas are shown here (CPC).
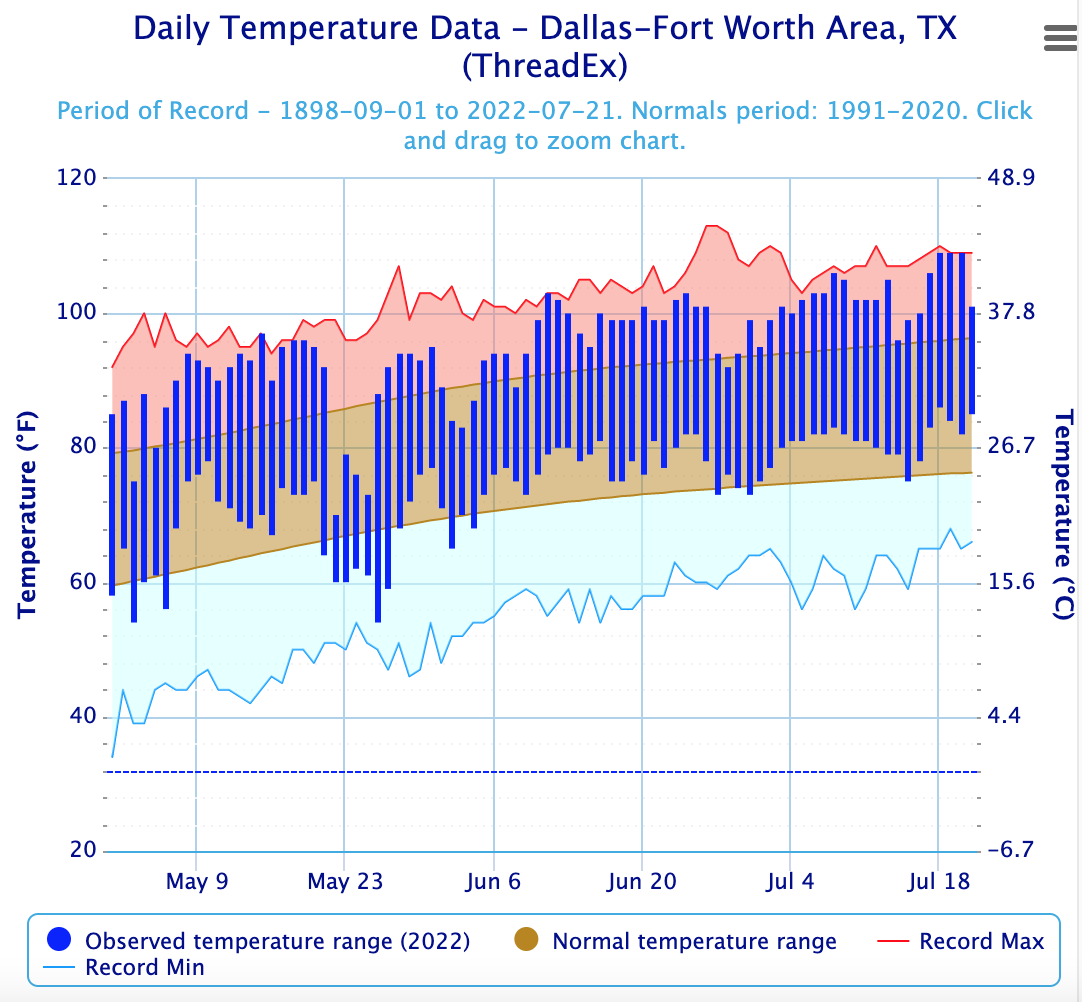
The Southern plains often see the most persistent heat in La Ninas. So far, there have been 26 100F days in Dallas, TX in 2022. No end is in sight until heavy rains develop and put out the fire. Some showers and storms yesterday lowered maximums a bit yesterday.
See how after a cold spell in May, it has been increasingly hot in Dallas.
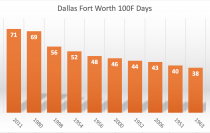
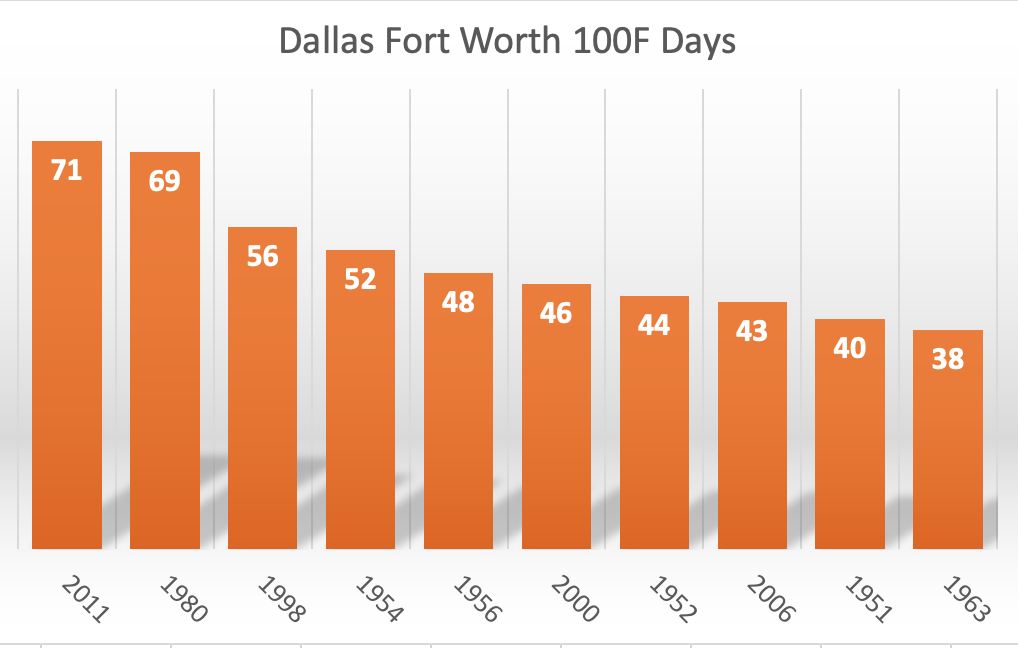
Models have more showers the next two weeks. But without an organized event (like a tropical event), it is difficult to get enough rains to suppress highs in mid-summer for longer periods. Dallas since 1950 has had as many as 71 days over 100F.
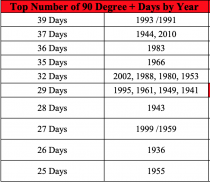
NUMBER OF 100F DAYS IN DALLAS SINCE 1950
All are La Nina years.
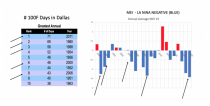
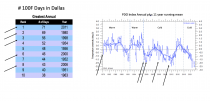
Enlarged
We can see below the hot summers were indeed in strong, multi-year La Ninas (negative MEI v2 (Multivariate ENSO Index) usually found in periods of a negative PDO (Pacific Decadal Oscillation).
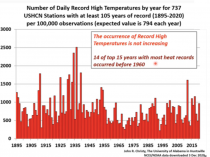
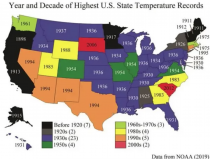
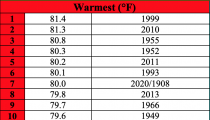
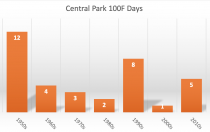
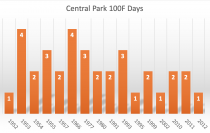
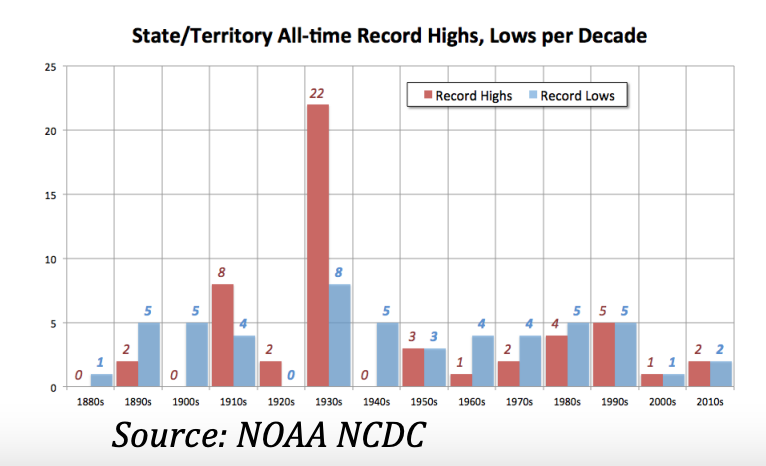
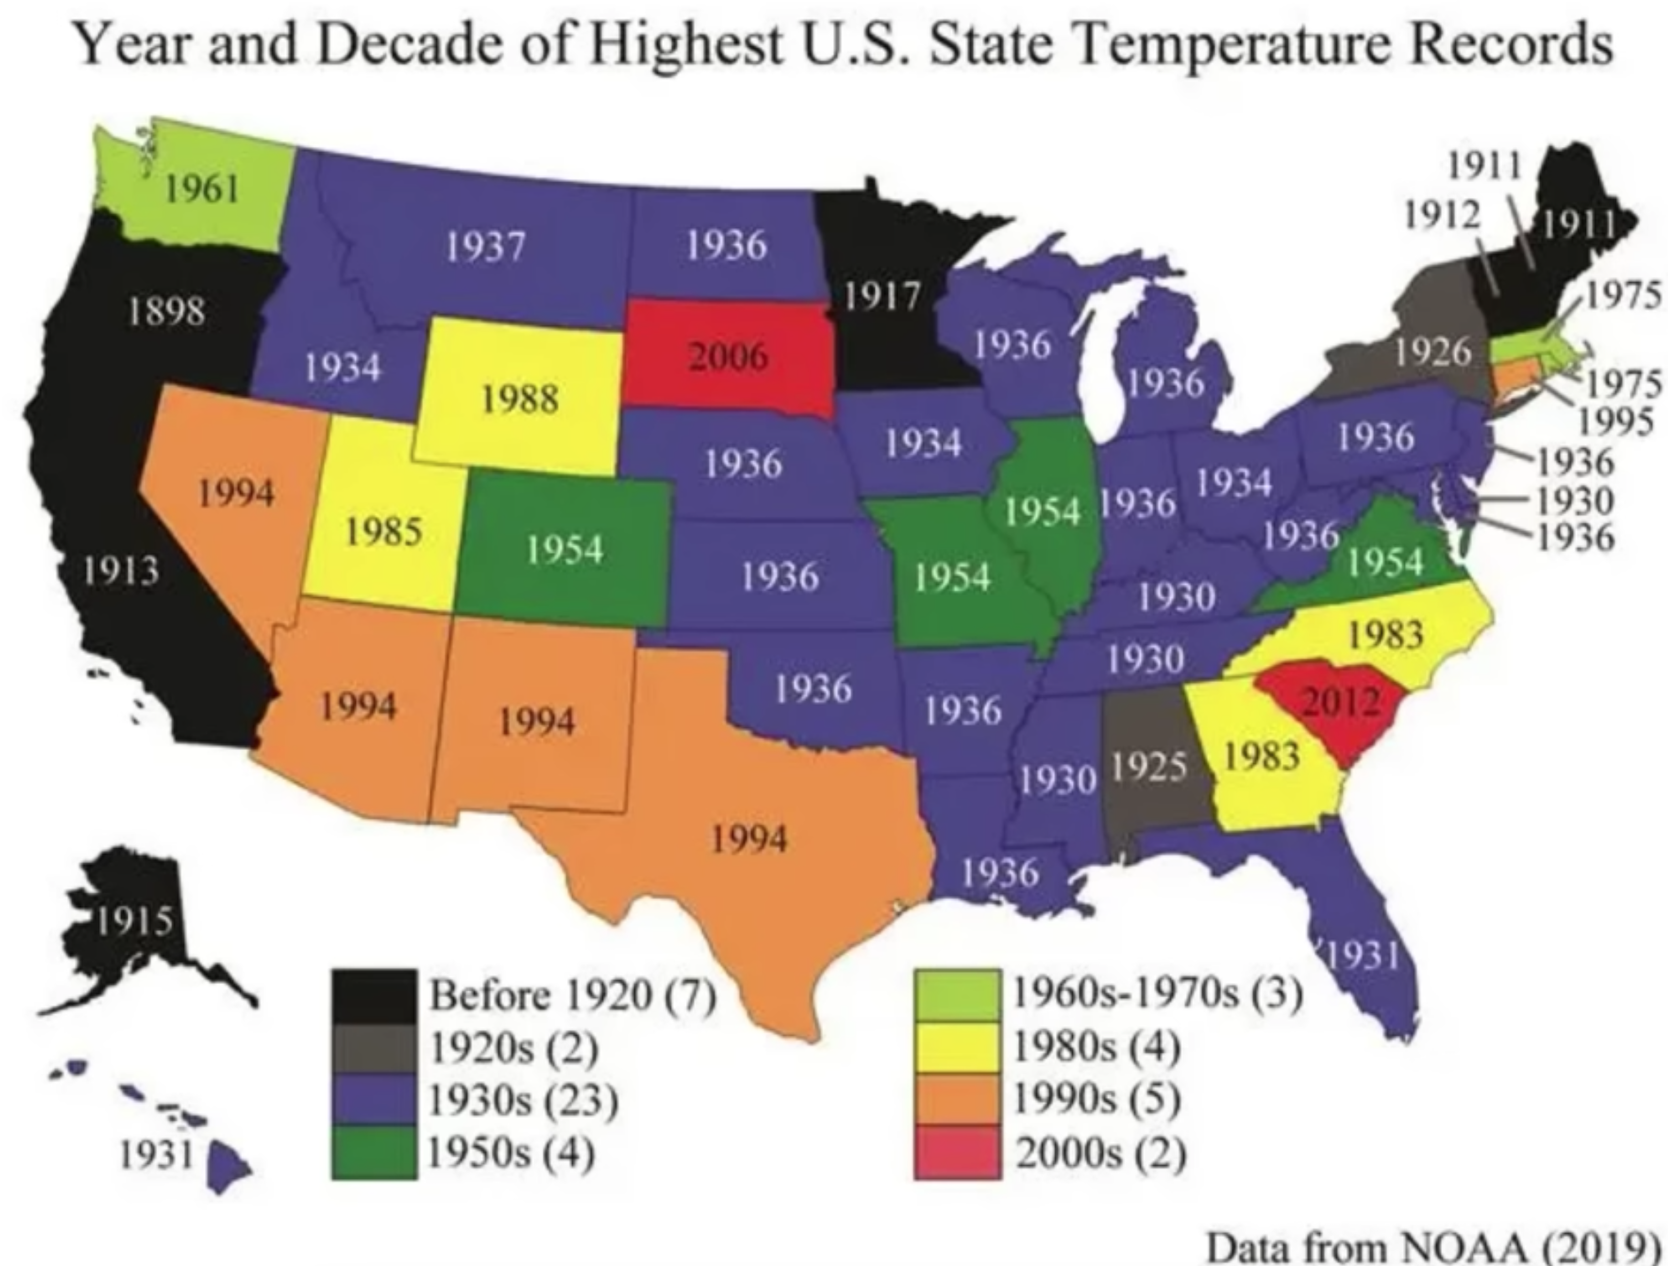
As the Dallas data showed, heat is not a new phenomenon nor getting more frequent. In fact, the warmest decade for Texas and the entire U.S. by far was the 1930s. 22 state/territory all-time heat records still reside in the record books in the 1930s. There have been more record lows since the 1940s than record highs.
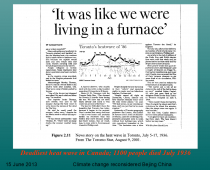
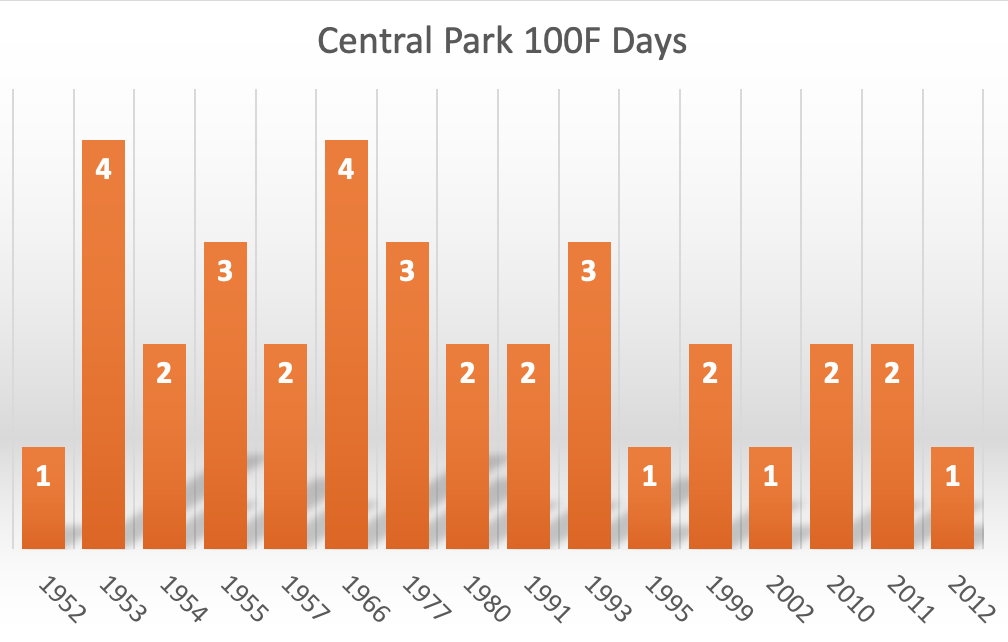
In NYC, 7 of the top 10 warmest Julys in Central Park occurred in La Nina summers. The other 3 were in years where ENSO was neutral and/or transitioning to La Nina. As of July 21, CPK has averaged 78.6F. 5 more hot days are forecast before temperature ease.
The current heat wave in the Big Apple in what had been a mostly moderate summer in the first half, will continue to Monday before the typical summer weather returns.
Central Park has had nine 90F days as of July 22, 2022. As many as 39 days have reached that level in the record.
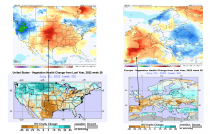
The soil moisture is a key factor in summer. When the soil is dry, the sun’s energy warms the ground and is not consumed in evaporating moisture back into the air. It amplifies any heat building in an amplified pattern.
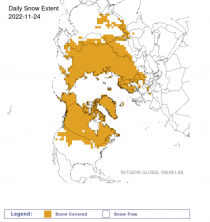
See the La Nina induced dryness effect on vegetation in the southern plains. Europe like the central US, has found itself in a part of the global wave pattern that has limited rainfall and enhanced the summer temperatures.
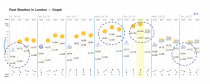
The UK is surrounded by water and often that limits the heat. However, the winds turned from off the warm continent into Britain for a few days last week and the temperatures spiked for two days until the maritime influence returned.
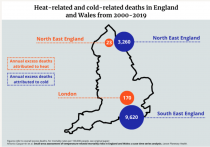
Even with the high heat, nights brought some relief. More seasonable air returned. In the UK, cold is a greater danger than heat especially as blackouts threaten in the winter when solar energy is limited given the latitude and cold often comes with little winds at night. Over 20% of the population are in energy poverty, often having to chose between heating and eating. Britain and most countries find 10 to 20 times more people die from cold than heat.
The west U.S. west of the Cascades and to the south the Sierra Nevada normally has natural air conditioner working with the cool waters of the eastern Pacific. Only when a pressure pattern strong enough to force downslope winds does the heat develop to the coast. The air is warmed by compression of the air as it descends into higher pressure near the surface. These episodes are usually brief.
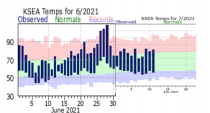
In late June 2021, a three-day heat wave besieged the near coastal areas of the droughty Pacific Northwest as a heat ridge set up in British Colombia on position to cause intermountain heat to sink down to the lower elevations with compression producing all-time record heat. See the brief heat burst in Seattle in late June.
These local heat events are not uncommon and often are found in urban areas near mountains and especially in dry years.
This event led to new record highs in the coastal cities as downslope winds kept the ocean cooling at bay. Triple digit heat is common in summer in the intermountain away from the ocean influence. But occasionally some of that heat makes its way to the coast and is superheated by compression as it sinks downslope.
This event was similar to Sundowner, dubbed a “poison wind,” was reported June 17, 1859, by the Coastal Pilot of California. According to the report, the morning air temperature of 75 to 80 degrees rose steadily until about 1 p.m., when a series of superheated waves of wind blasted the Santa Barbara area.
By 2 p.m., the air temperature reached 133 degrees and hovered there for three hours, killing small animals, destroying fruit, ruining gardens and heavily damaging trees the newspaper reported. That year a similar powerful heat ridge likely forced the wind to sink off the mountains to the north and superheat just as we saw this June.
These events are usually brief and these local oddities not signs of man-made changes.
Many heat records occurred in locations where downslope winds add heat to transitory very warm air masses - found in the east coastal states of the United States, Canada, Europe, Asia, Africa, Australia and even the Antarctic Peninsula.
The metropolitan areas of the Mid-Atlantic and Northeast U.S., when heat ridges build east from the central in summer experience this compressional warming from downslope winds which also block any sea breezes. Most of the triple digit readings and high records here occur with west to northwest winds.
-----
Share this with those who need to hear the truth. Help us if you can.
Imagine the theory of gravity being determined by a partisan vote. Or a group of politicians ruling on interpretations of the laws of modern physics. Bizarre as those propositions sound, that is what is happening in climate science.
Scientific research is done predominantly in academia, where truth is supposedly established through years of work that is financially supported by government or private entities. Sometimes, the financiers of research desire particular outcomes for their money.
Human nature being what it is, ulterior motives creep into researchers’ methods and results when funding sources have a point view that is made known to scientists applying for grants and working in laboratories. A sort of predeterminism arises where the funder’s interests are given priority over time-proven scientific methodologies.
There are large factions of politicians and scientists committed to a baseless narrative that emissions of carbon dioxide from human activity are leading to an apocalyptic warming of Earth. With the enthusiasm of religious zealots and the ruthlessness of the power-mad, a climate industrial complex is driving energy policy on the basis of a hundred or so badly flawed computer models. More than 95 percent of these digital prognosticators have proven unreliable in predicting climatic trends. Yet, they are used anyhow.
In simple terms, the models are designed to exaggerate the potency of atmospheric carbon dioxide as a greenhouse gas. Consequently, the models overstate future warming. The magnification of forecasted warming is revealed by retrospectively comparing model results to actual, historical temperatures.
A 2020 scientific analysis revealed that “models overpredict warming in every target observational analog, in most cases significantly so, and the average differences between models and observations are statistically significant.”
Scientist Ross McKitrick calls out errors of modelers that exaggerate future temperature increases.
“I get it that modeling the climate is incredibly difficult, and no one faults the scientific community for finding it a tough problem to solve,” writes McKitrick. “But we are all living with the consequences of climate modelers stubbornly using generation after generation of models that exhibit too much surface and tropospheric warming, in addition to running grossly exaggerated forcing scenarios.” Forcing is the mechanism by which greenhouse gases warm the atmosphere.)
“in 2005 in the first report of the then-new U.S. Climate Change Science Program, (others) pointed to the exaggerated warming in the tropical troposphere as a ‘potentially serious inconsistency,’” McKitrick says. “But rather than fixing it since then, modelers have made it worse. (The report writers) note that in addition to the wrong warming trends themselves, the biases have broader implications because ‘atmospheric circulation trends depend on latitudinal temperature gradients.’”
Why do researchers continue to use models that are known to exaggerate warming? To produce outcomes that support a view politically popular with the climate obsessed?
It would seem so, given the profit motive and the lucrative nature of the current pernicious cycle: Governments advance their doomsday narrative, scientists and research institutions get grants, the green lobby secures investments and subsidies for uneconomic and ineffective technologies, and political candidates embrace the hysteria in exchange for campaign contributions.
This is all supported by working people who pay excessive taxes and unnecessarily high energy bills. Some employed in the fossil fuel industry pay with loss of livelihoods. The price for the poorest among us - particularly in the developing world - may be lives lost through further impoverishment and early death.
Some climate warmists may be ignorant of science’s corruption. However, others cynically take advantage of it for money and power. At some point, this facade will collapse because of the lack of reality behind it. Nonetheless, we are obligated to do what we can to accelerate the falsehood’s dismantlement if only to honor sacrifices made by others in the name of truth.
In the 16th century, Martin Luther freed millions from the tyranny of a corrupt church by refusing to recant what he knew to be true. He managed to avoid torture and death by fire for his alleged heresies. Others were not so fortunate.
Yet our obligation is deeper than memorializing the past. As biographer Eric Metaxas writes: “In the end, what Luther did was not merely to open a door in which people were free to rebel against their leaders but to open a door in which people were obliged by God to take responsibility for themselves.”
Those who recognize the wrong can do no other than to point it out. And so we do.
Gregory Wrightstone is a geologist; executive director of the CO2 Coalition, Arlington, Va.; and author of “Inconvenient Facts: The science that Al Gore doesn’t want you to know.”


