Dec 21, 2008
Please Help Support Icecap
Dear Icecap Readers:
Donations would be appreciated. Even small ones help.
ICECAP is the portal to all things climate for elected officials and staffers, journalists, scientists, educators and the public. It provides access to a new and growing global society of respected scientists and journalists that are not deniers that our climate is dynamic (the only constant in nature is change) and that man plays a role in climate change through urbanization, land use changes and the introduction of gases and aerosols, but who also believe that natural cycles such as those in the sun and oceans are also important contributors to the global changes in our climate and weather.
We worry the sole focus on greenhouse gases and the unwise reliance on imperfect climate models while ignoring natural cycles and real data may leave civilization unprepared for a sudden climate reversal that history tells us will occur again, very possibly soon (may have already started). We worry also that inaccurate forecasts lead to bad energy decisions and unwise regulatory policy, something we can ill afford in these economically tough times.
ICECAP provides timely access to our experts here in the United States and to experts and partner organizations worldwide, many of whom maintain popular web sites or insightful blogs or newsletters, write and present peer reviewed papers, have authored books and offer interviews to the media on climate issues. We spotlight new findings in peer-review papers and reports and rapidly respond to fallacies or exaggerations in papers, stories or programs and any misinformation efforts by the media, politicians and advocacy groups.
We have 2300 stories on the site, all of which are archived and searchable by topic and author. Our special Climate Library features nearly 100 stories and peer review papers.
Please consider contributing to the ICECAP and other similar blogs this month (by mail or using the donate button to the left). Your contribution will allow us to continue our watchdog work in a tough economic climate. See our full letter here.
Best of the holiday season and thanks for your support.
Joseph D’Aleo
Dec 19, 2008
The Deadliest U.S. Natural Hazard: Extreme Cold
By Indur Glokany
Reuters reports that: Heat is more likely to kill an American than an earthquake, and thunderstorms kill more people than hurricanes do, according to a U.S. “death map” published on Tuesday. Heat and drought caused 19.6 percent of total deaths from natural hazards, with summer thunderstorms causing 18.8 percent and winter weather causing 18.1 percent, the team at the University of South Carolina found. However, the result that heat is the most deadly natural hazard seems to be an artifact of the data source employed by the authors of the so-called “death map.” Their primary data source is the National Climatic Data Centers Storm Data. However, the NCDC data for mortality from extreme heat and cold is questionable.
As is evident from the paper, the authors are aware that mortality data for these two types of extreme events from NCDC are substantially different from mortality data from the Center for Disease Control (CDC) based on the Compressed Mortality File for the United States. The latter uses death certificate records, which provide the cause of each recorded death (based on medical opinion). I would contend that when it comes to cause of death, particularly for extreme cold and heat, medical opinion as captured in death certificate records is probably more reliable than determinations made by the meteorologists in the National Oceanic and Atmospheric Administration’s NCDC.
The following table from Goklany (2007) provides a breakdown of mortality due to the major types of extreme weather events for 1979-2002 based on data from the CDC database for extreme cold and extreme heat, and various arms of the National Oceanic and Atmospheric Administration for floods, lightning, hurricanes, and tornadoes. It indicates that extreme cold, rather than heat, is the deadliest form of extreme weather event. In fact, over this period, extreme cold was responsible for slightly more than 50 percent of deaths during this period for the categories listed in the table.
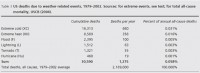
See large table here
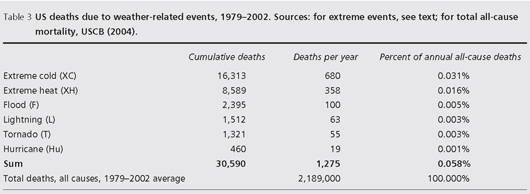
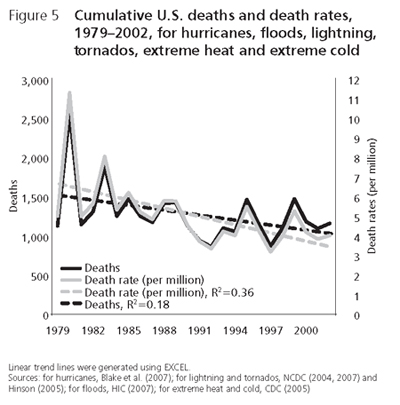
Note that despite the hoopla about natural weather disasters, they contribute less than 0.06% to the annual U.S. death toll! Moreover, as the following figure, also from Goklany (2007), shows, both US death and death rates from weather events are declining, despite any climate change, which we are assured can only make matters worse.

See larger graph here
Finally, the Reuters report notes, “Researchers who compiled the county-by-county look at what natural disasters kill Americans said they hope their study will help emergency preparedness officials plan better.” [The study was apparently funded by the Department of Homeland Security.] As a taxpayer, I hope that emergency preparedness officials look beyond this study to identify and prepare for future emergencies, or they might miss out on the larger disasters, even as they prepare for lesser ones. Read full post here.
NOAA NCDC continues to degrade their credibility. Not only are they cooking the books on temperature adjustments but are doing it on mortality statistics to make heat look more of a threat. Soon I would expect them to start denying the existence of the dust bowl and 1930 heat records which to this day dominate the record books.
Dec 19, 2008
Chicago Headed towards Top Five Snowiest December - Rare Snow Socks Las Vegas
By Tom Skilling, WGN/Chicago Tribune Meteorologist
Ice, snow and thunder loom with latest storm Chicago’s 7th snowiest December in 124 years is about to get even snowier. The second major winter storm in a week—this one wetter and stronger—hits with thunder Thursday night and Friday morning. Its track will dictate how the cocktail of precipitation it
produces is distributed across the area. Current indications point toward major snow and sleet accumulations roughly north of Interstate Highway 80 with serious icing—capable of snapping power lines and downing branches—being a problem late Thursday night in the south.
Computer models and various snowfall forecast techniques suggest the storm’s 12 to 14 hours of steady precipitation will reach the city between 8 p.m. and midnight. Estimates of the storm’s water equivalent precipitation range from 0.86 inches to 1.75 inches—three to six times the moisture generated by Tuesday’s system. That could translate to 6 to 14 inches of snow over parts of the metro area—especially north—into Wisconsin. The presence of t-storms may lead to bursts of heavy precipitation.
RARE SNOW SOCKS LAS VEGAS
Two to 6 inches of snow hit Las Vegas Wednesday. The last time that much snow fell there was in 1979 when 7.9 inches fell. Read more here.
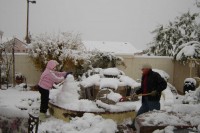
Photo from Las Vegas Now - larger image here. See also story here and here and here. (H/T Metsul)
Icecap Note: Heavy snow in Las Vegas occurs about once every 25-30 years - according to National Weather Service records, the most snowfall recorded in the Las Vegas Valley was 16.7 inches in January 1949, followed by January 1974 with 13.4 inches and January 1979 with 9.9 inches. A cold Pacific is usually the prerequisite for snow there, something clearly the case this year.
Dec 17, 2008
Pre-industrial CO2 Levels Were About the Same as Today. How and Why We are Told Otherwise?
By Dr.Tim Ball, Canada Free Press
How many failed predictions, discredited assumptions and evidence of incorrect data are required before an idea loses credibility? CO2 is not causing warming or climate change. It is not a toxic substance or a pollutant. Despite this President Elect Obama met with Al Gore on December 9 no doubt to plan a climate change strategy based on these problems. They make any plan to reduce of CO2 completely unnecessary.
Proponents of human induced warming and climate change told us that an increase in CO2 precedes and causes temperature increases. They were wrong. They told us the late 20th century was the warmest on record. They were wrong. They told us, using the infamous “hockey stick” graph, the Medieval Warm Period (MWP) did not exist. They were wrong. They told us global temperatures would increase through 2008 as CO2 increased. They were wrong. They told us Arctic ice would continue to decrease in area through 2008. They were wrong. They told us October 2008 was the second warmest on record. They were wrong. They told us 1998 was the warmest year on record in the US. They were wrong it was 1934. They told us current atmospheric levels of CO2 are the highest on record. They are wrong. They told us pre-industrial atmospheric levels of CO2 were approximately 100 parts per million (ppm) lower than the present 385 ppm. They are wrong. This last is critical because the claim is basic to the argument that humans are causing warming and climate change by increasing the levels of atmospheric CO2 and have throughout the Industrial era. In fact, pre-industrial CO2 levels were about the same as today, but how did they conclude they were lower?
In a paper submitted to the Hearing before the US Senate Committee on Commerce, Science, and Transportation Professor Zbigniew Jaworowski explains, “The basis of most of the IPCC conclusions on anthropogenic causes and on projections of climatic change is the assumption of low level of CO2 in the pre-industrial atmosphere. This assumption, based on glaciological studies, is false.”
Ice cores provide the historic record and data collected at Mauna Loa the recent record. Both records are drastically modified to produce a smooth continuous curve with little variability. This was necessary to confirm the evidence falsely concluded from many 19th century measures that pre-industrial levels were approximately 280 ppm and didnt vary much. So how did they engineer the smooth curves and ignore the fact the 19th century record shows a global average of 335 ppm and considerable variability from year to year.
Most people don’t know that thousands of direct measures of atmospheric CO2 were made beginning in 1812. Scientists took the readings with calibrated instruments and precise measurements as the work of Ernst-Georg Beck has thoroughly documented. Guy Stewart Callendar was an earlier visitor to these records. He rejected most of the records including 69% of the 19th century records and only selected certain records that established the pre-industrial level as 280 ppm. Here is a plot of the records with those Callendar selections circled:
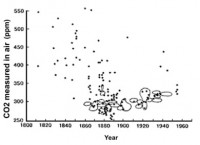
It is clear how only low readings were chosen. Also notice how the slope and trend is changed compared to the entire record. As Jaworowski notes,
“The notion of low pre-industrial CO2 atmospheric level, based on such poor knowledge, became a widely accepted Holy Grail of climate warming models. The modelers ignored the evidence from direct measurements of CO2 in atmospheric air indicating that in 19th century its average concentration was 335 ppmv.” Beck recently confirmed Jaworowski’s research. A September 2008 article in Energy and Environment examined the readings in great detail and validated the 19th century findings.
Modern greenhouse hypothesis is based on the work of G.S. Callendar and C.D. Keeling, following S. Arrhenius, as latterly popularized by the IPCC. Review of available literature raise the question if these authors have systematically discarded a large number of valid technical papers and older atmospheric CO2 determinations because they did not fit their hypothesis? Obviously they use only a few carefully selected values from the older literature, invariably choosing results that are consistent with the hypothesis of an induced rise of CO2 in air caused by the burning of fossil fuel. Read more here.
Dec 16, 2008
NASA Models Can’t Get Simpler Mars Climate Right
By Irene Klotz, Reuters
NASA is still unable to say for sure whether its Phoenix lander has found a place where life could have existed on Mars.

But scientists working with the U.S. space agency said on Monday computer models they have been using to predict what the weather would be like on the Red Planet are wrong, and more accurate models would give a better picture of its past.
Speaking at the opening day of the American Geophysical Union conference in San Francisco, Phoenix mission scientists laid out the early harvest from five months of robotic operations on the northern polar region of Mars.
In addition to analyzing ice and soil samples for organic material, a process that is still under way, the Phoenix science team collected daily weather reports, information considered critical to learning if the planet could have supported water long enough for life to evolve. “It’s a very active weather environment,” lead investigator Peter Smith told reporters in a teleconference. “It’s a bit of a mystery how this is happening.”
Phoenix saw dusty summer days slip into cloudy fall, replete with ground fog, snow and frost. “Global climate models that are running on Mars would not predict this,” Smith said. “What we’re learning now about the polar region is going to force us to make changes.”
More accurate computer models would give scientists a clearer picture of what happened in Mars’ past, particularly when the planet’s axial tilt, or obliquity, was greater than it is now.
Without a large moon for stabilization, Mars’ polar regions periodically shift off axis by more than 35 degrees. During those times, the sun would rise higher in the sky above the Martian poles, making for warmer summers.
Scientists are trying to determine if there was ever a period of time when it would have been warm enough for water, considered a key ingredient for life as we know it.
“We’re really trying to understand if this was ever a wetter environment,” Smith said.
“If we can update these global circulation models and we can understand better about the polar weather, then we can look back in time to see if liquid water was ever a dominant influence on this soil in this location.”
Read more here.
|

