
|
Mar 24, 2012
FactCheck.org misrepresents the dangers of carbon dioxide
By James D. Agresti
FactCheck.org is a project of the Annenberg Public Policy Center of the University of Pennsylvania. Its mission is to “apply the best practices of both journalism and scholarship” to “reduce the level of deception and confusion in U.S. politics.”
FactCheck.org recently published an article entitled “Santorum’s science,” by Lori Robertson. In this piece, Robertson criticizes Rick Santorum for a statement he made about global warming on March 12th in Biloxi, Mississippi. Alluding to the fact that carbon dioxide (CO2) is a vital ingredient for plant life, Santorum quipped, “The dangers of carbon dioxide? Tell that to a plant, how dangerous carbon dioxide is.”
Robertson attempts to refute Santorum’s remark by declaring:
“Too much” CO2 “is definitely a bad thing.”
“Exposure to high levels of CO2 can cause ‘headaches, dizziness, restlessness ... coma, asphyxia to convulsions ... and even frostbite if exposed to dry ice,’ which is solid CO2.”
“Plants do, in fact, absorb CO2. But even plants might not like too much of it. A 2008 study conducted at the University of Illinois found that instead of increasing organic matter in soil, higher carbon dioxide levels actually led to less organic matter.”
These statements are materially misleading. Let’s examine them one at a time.
FactCheck.org: “Too much” CO2 “is definitely a bad thing.”
The same can be said of just about every substance known to man. The most basic principle of toxicology is that “the dose makes the poison.” As explained in a Cambridge University Press textbook, Understanding Environmental Pollution (page 60), “Anything is toxic at a high enough dose. Even water, drunk in very large quantities, may kill people by disrupting the osmotic balance in the body’s cells.”
Likewise, even oxygen can be toxic when breathed in high concentrations. Per The Johns Hopkins Manual of Gynecology and Obstetrics (page 40), “when there is too much oxygen ... the lungs may be damaged, as in acute repository distress syndrome (ARDS).”
Thus, it is meaningless to proclaim that “too much” of any particular substance is “a bad thing.” Instead, the pertinent matter is, “When does it become a bad thing?” which leads directly to the next point.
FactCheck.org: “Exposure to high levels of CO2 can cause ‘headaches, dizziness, restlessness...coma, asphyxia to convulsions… and even frostbite if exposed to dry ice,’ which is solid CO2.”
This statement is irrelevant to the issue at hand. Santorum was speaking about global warming and atmospheric CO2- not ventilation deathtraps, industrial hazards, and dry ice. The truth is that atmospheric CO2 levels don’t approach anywhere near the doses that can cause the symptoms that Robertson lists.
Using data from multiple academic sources, Just Facts has documented that carbon dioxide produces no adverse physiological effects on humans until concentrations exceed 50 times the level in Earth’s atmosphere. Furthermore, natural emissions of CO2 outweigh man-made emissions by a factor of twenty to one.
Some of Robertson’s confusion may stem from the source that she cites for the dangers of CO2, which is a cut sheet from the Wisconsin Department of Health and Family Services. This document contains a major recurring error. The figures given for CO2 concentrations that cause various adverse effects are mistaken by more than a factor of ten.
For example, the cut sheet says that exposure to CO2 concentrations above 5,000 parts per million (ppm) “may lead to serious oxygen deprivation resulting in permanent brain damage, coma and even death.” As detailed by the National Research Council (and many other academic sources), humans can be routinely exposed to more than ten times this level of CO2 for days on end without any indications of permanent brain damage or threat of death. In fact, it takes prolonged CO2 exposures of more than 20,000 ppm just to cause occasional, mild headaches.
FactCheck.org: “Plants do, in fact, absorb CO2. But even plants might not like too much of it. A 2008 study conducted at the University of Illinois found that instead of increasing organic matter in soil, higher carbon dioxide levels actually led to less organic matter.”
First, according to the article that Robertson cites for this claim, this study found that higher CO2 levels “may” have led to less organic matter in the soil of a certain soybean crop. This is different from claiming that higher CO2 “actually” led to less organic matter in plant soil.
Far more significantly, Robertson fails to mention that the study found “a 30 percent increase in above- and below- ground soybean biomass” among the crops exposed to more CO2. In plain language, these soybean plants grew 30% larger. They did, in fact, “like” the added CO2.
Note that this study was conducted at a CO2 level of 550 ppm, as compared to the current atmospheric CO2 concentration of about 387 ppm. Bear those figures in mind, because the study’s result accords with an academic text that explains how to increase the productivity of commercial greenhouses:
Plants need water, light, warmth, nutrition and CO2 to grow. By increasing the CO2 level in the greenhouse atmosphere (typical to 600 ppm instead of normal 400 ppm value), the growth for some plants can be stimulated in an important way, with often yield increases up to 20%, especially for tomato, cucumber, strawberry, etc. but also for potted plants and cut flowers.
In sum, Santorum is correct. CO2 concentrations well above todays atmospheric levels are typically beneficial to plants.
Icecap Note: We breathe out air at 40,000ppm. Most workplaces and classrooms, auditoriums have levels 1000-2000 ppm. Submarines have measured levels of 6000-11,000ppm with not documented effects. Although we applaud the efforts fo fact checking on politicians and groups like the American Lung Association, AARP, etc, they haave to do a better job. The details in this fact check on factcheck could have been easily found on CO2Science.org .
Mar 14, 2012
The long sunspot cycle 23 predicts a significant temperature decrease in cycle 24
Jan-Erik Solheima, Kjell Stordahl, Ole Humlum
Relations between the length of a sunspot cycle and the average temperature in the same and the next cycle are calculated for a number of meteorological stations in Norway and in the North Atlantic region. No significant trend is found between the length of a cycle and the average temperature in the same cycle, but a significant negative trend is found between the length of a cycle and the temperature in the next cycle. This provides a tool to predict an average temperature decrease of at least from solar cycle 23 to solar cycle 24 for the stations and areas analyzed. We find for the Norwegian local stations investigated that 25-56% of the temperature increase the last 150 years may be attributed to the Sun. For 3 North Atlantic stations we get 63-72% solar contribution. This points to the Atlantic currents as reinforcing a solar signal.
-------
Highlights
* A longer solar cycle predicts lower temperatures during the next cycle.
* A 1 C or more temperature drop is predicted 20092020 for certain locations.
* Solar activity may have contributed 40% or more to the last century temperature increase.
* A lag of 11 years gives maximum correlation between solar cycle length and temperature.
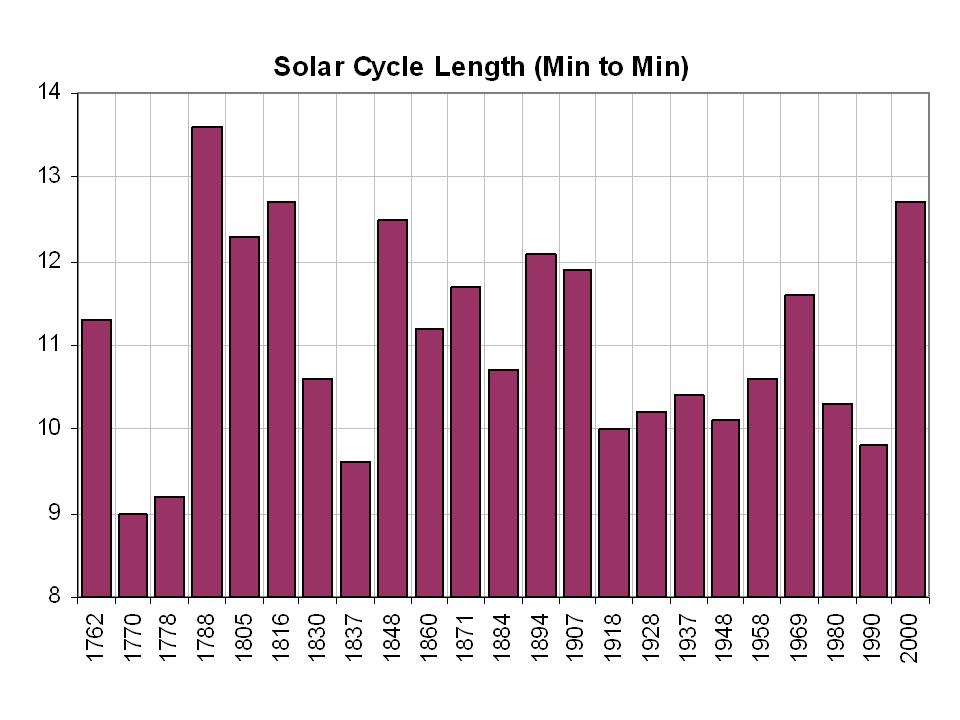
Our analysis shows the variation in the length of solar cycles, we realize that short cycles like the one that ended in 1996, have only been observed three times in 300 years. After the shortest cycles, sudden changes too much longer cycles have always taken place, and thereafter there is a slow shortening of the next cycles, which take many cycles to reach a new minimum. This recurrent pattern tells us that we can expect several long cycles in the next decades. Analysis of the SCL back to 1600 has shown a periodic behavior with period 188 year, now entering a phase with increasing SCL the next (Richards et al., 2009).
de Jager and Duhau (2011) concludes that the solar activity is presently going through a brief transition period (20002014), which will be followed by a Grand Minimum of the Maunder type, most probably starting in the twenties of the present century. Another prediction, based on reduced solar irradiance due to reduced solar radius, is a series of lower solar activity cycles leading to a Maunder like minimum starting around 2040 (Abdussamatov, 2007).
See the entire study which goes into great detail for many Northwest Europe and arctic region temperatures. They find little correlation with the current cycle but significant correlation with the following cycle. There work suggests temperatures should accelerate down this decade - an 11 year lag with the minimum of ultra long cycle 23 (12.5 years) was in 2008 would mean significant cooling by 2018.
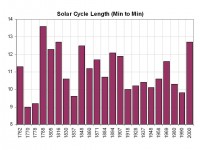
Enlarged. Year of max shown.
See in this PDF by David Archibald how major cooling will be the problem in decades ahead not warming (climate slides at page 36).
Mar 14, 2012
Water vapor, not CO2, controls climate and acts as a negative feedback
Hockey Schtick
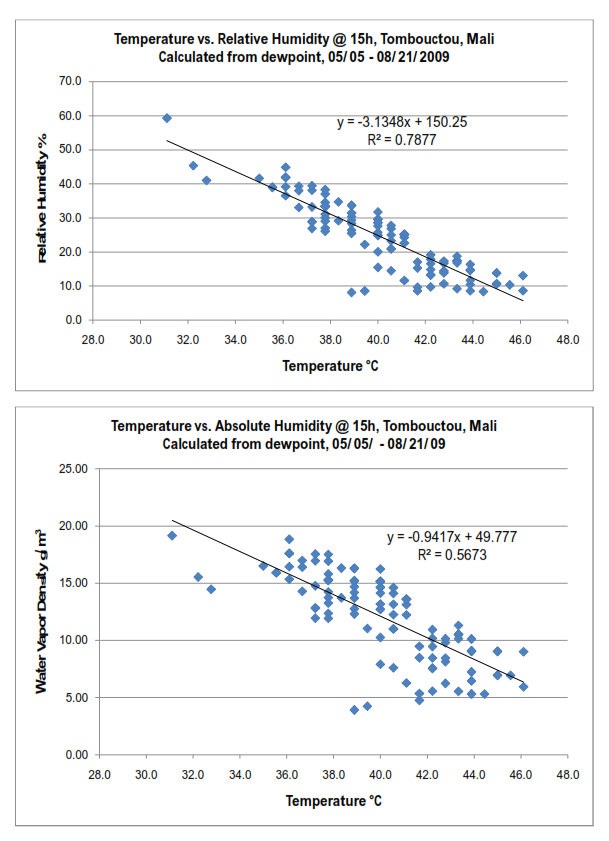
Physicist Daniel Sweger refutes the catastrophic AGW hypothesis in his paper The Climate Engine, showing that CO2 has a negligible effect upon climate and that water vapor acts as a negative feedback to global warming. Dr. Sweger uses data from 3 locales to show an inverse relationship between humidity and temperature. He notes, “In the positive feedback mechanism as proposed by the global warming proponents this behavior would be reversed. Then the data would show a positive relationship between moisture content and temperature. But it does not. As suggested before, data is the language of science, not mathematical models.”
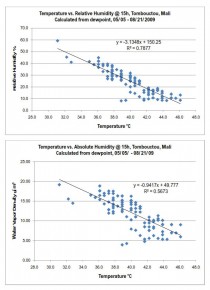
Enlarged.
The data clearly shows that the relationship between the amount of water vapor in the air and temperature is negative
From the conclusion of The Climate Engine:
The role of water vapor in determining surface temperatures is ultimately a dominant one. During daylight hours it moderates the suns energy, at night it acts like a blanket to slow the loss of heat, and carries energy from the warm parts of the earth to the cold. Compared to that, if carbon dioxide has an effect, it must be negligible.
It is also clear from the data presented above that water vapor acts with a negative feedback. The data clearly shows that the relationship between the amount of water vapor in the air and temperature is negative; that is, the higher the amount of water vapor in the atmosphere the lower the surface temperature. In that regard, it almost acts as a thermostat.
As the air cools as a result of an increasing moisture content in the atmosphere, there is a decrease in the amount of water vapor produced by evaporation. Eventually this decrease of the level of water vapor being introduced into the atmosphere results in a decrease in moisture content. At this point more sunlight reaches the earths surface resulting in higher temperatures and increasing evaporation.
In the positive feedback mechanism as proposed by the global warming proponents this behavior would be reversed. Then the data would show a positive relationship between moisture content and temperature. But it does not.
As suggested before, data is the language of science, not mathematical models.
About the Author
Dr. Daniel M. Sweger, AB (Physics, Duke University, 1965) and Ph.D. (Solid State Physics, American University, 1974) has been a research scientist at NIST, where he was active in a variety of research areas, including cryogenic thermometry, solid state and nuclear physics, and molecular spectroscopy. He also operated a computer software business and performed consulting for the US Army. He is now semi- retired and is an adjunct instructor at National College of Business and Technology (www.ncbt.edu), where, among other subjects, he teaches Environmental Science.
Mar 11, 2012
GHCN and GISS Adjustments Affect 40% Of The Arctic with artificial warming
By Paul Homewood
There has been much discussion recently about temperature adjustments made by GHCN in Iceland and Greenland, which have had the effect of reducing historic temperature levels, thereby creating an artificial warming trend. These can easily be checked at the GISS website, where both the old and new datasets can be viewed as graph and table data, here and here.
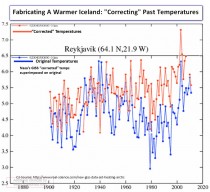
Enlarged
It has now been identified that similar adjustments have been made at nearly every station close to the Arctic Circle, between Greenland and, going East,via Norway to Siberia, i.e 56 Degrees West to 86 Degrees East, about 40% of the circumference.
So it is perhaps time to recap where we are now.
Background
The NCDC has produced the Global Historical Climatology Network (GHCN), a dataset of monthly mean temperatures, since the 1990s. Version 2 was introduced in 1997 and included “Methods for removing inhomogeneities from the data record associated with non-climatic influences such as changes in instrumentation, station environment, and observing practices that occur over time “. The GHCN datasets are used by both GISS and HADCRUT for calculation of global temperatures, as well as NCDC themselves.
In May 2011, NCDC brought out Version 3, which “enhanced the overall quality of the dataset”, but made little difference in overall terms. However, only two months later in July, a Google Summer Student, a graduate called Daniel Rothenberg, was brought in to convert some of the GHCN software and make modifications to “correct software coding errors”. The result was Version 3.1, which went live in November 2011.
It is this latest version that has thrown up the Arctic adjustments we are now seeing.
Until December, GISS used Version 2 unadjusted temperatures. Since then, they have changed to using Version 3.1 adjusted temperatures.
Basis of Homogeneity Adjustments
It is worth taking time to be clear why temperature adjustments are made (or should be). As far as GHCN are concerned, they explain their logic thus :-
Surface weather stations are frequently subject to minor relocations throughout their history of operation. Observing stations may also undergo changes in instrumentation as measurement technology evolves. Furthermore, observing practices may vary through time, and the land use/land cover in the vicinity of an observing site can be altered by either natural or man-made causes. Any such modifications to the circumstances behind temperature measurements have the potential to alter a thermometer’s microclimate exposure characteristics or otherwise change the bias of measurements relative to those taken under previous circumstances. The manifestation of such changes is often an abrupt shift in the mean level of temperature readings that is unrelated to true climate variations and trends. Ultimately, these artifacts (also known as inhomogeneities) confound attempts to quantify climate variability and change because the magnitude of the artifact can be as large as or larger than the true background climate signal. The process of removing the impact of non-climatic changes in climate series is called homogenization, an essential but sometimes overlooked component of climate analysis.
It is quite clear. Their algorithms should look for abrupt changes that are not reflected at nearby stations. It has nothing to do with “averaging out regional temperatures” as is sometimes claimed.
GISS also make homogeneity adjustments, but for totally different reasons. In their case, it is to make an allowance for the Urban Heat Island Effect (which is not spotted by GHCN because it is a slow change).
Effect of The Adjustments
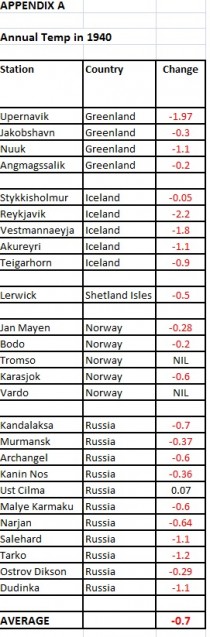
Appendix A lists every current GHCN station with records back to 1940,that lie between Greenland, at a latitude of 56 W, around to a point about midway across Siberia at 86 E and which are situated close to the Arctic Circle. The table shows the adjustment made by GHCN for 1940 data. Out of 26 stations, the adjustment has reduced actual temperatures in 23 cases, many substantially. In contrast, 2 remain unchanged and only one has a positive adjustment (and this is insignificant). As a crude average, the adjustment works out at a reduction of 0.70 C.
These adjustments typically extend back to the beginning of the station records (though Reykjavik is an exception) and most continue at the same level till about 1970. ( Some of the Russian stations last longer - e.g. Ostrov Dikson’s disappears in 2009).
By 2011, however, the adjustments disappear at ALL of these sites. In other words, an artificial warming trend has been manufactured.
It is worth spelling out two points :-
1) Within this arc of longitude, there are no other stations within the Arctic Circle.
2) With the exception of Lerwick and Vestmanneyja, I can find no stations, in the region, below a latitude of 64 North with similar adjustments. Why is 64 North significant? GISS produce zonal temperature data, and their “Arctic” zone goes from 64 North to the Pole. Coincidence?
Is there any justification for adjusting?
Trausti Jonsson, a senior climatologist at the Iceland Met Office, has already confirmed that he sees no reason for the adjustments in Iceland and that they themselves have already made any adjustments necessary due to station moves etc before sending the data onto GHCN.
Clearly the fact that nearly every station in the region has been adjusted disproves the idea that these sites are outliers, which give biased results not supported by nearby stations.
GHCN were asked in January to investigate this issue and so far have failed to come up with any explanation. Unless they can do this, the assumption must be that the adjustments have been created by faulty software.
Discussion
In global terms, these few stations make no tangible difference to overall temperatures. However, they do make a significant difference to temperatures in the Arctic, which are derived from a small number of stations such as these and then projected over hundreds of miles.
Across much of the Arctic, temperatures were as high in the years around 1940 as they are now. History should not be revised at the whims of an algorithm.
What should happen next? In my view, GHCN should immediately revert to Version 3.0 until the matter is properly investigated and any issues resolved. They maybe just need to put Version 3.1 down as a bad experience and start from scratch again. I believe they also need to seriously review their Quality Control procedures and question how these anomalies were allowed to arise without being flagged up.
It should not be up to independent observers to have to do this.
Enlarged
Footnote
I originally set this table up yesterday, 9th March. Today I noticed a few had changed slightly, presumably at the monthly update, so have amended them. It appears GHCN are still fiddling with their algorithms as the same thing occurred last month.
Mar 08, 2012
Democrats Reject Bipartisan Attempt to Rein in Obama-EPA’s Job-Killing Agenda and also kill Keystone
Press Release
Washington, D.C. - Senator James Inhofe (R-OK), Ranking Member of the Senate Committee on Environment and Public Works, said today that despite their constant rhetoric that EPA needs to be reined in, Senate Democrats once again voted against an amendment that would save jobs. This amendment, sponsored by Senator Susan Collins (R-ME) would provide a legislative fix for the Obama Environmental Protection Agency’s (EPA) botched Maximum Achievable Control Technology (MACT) rule for industrial boilers (Boiler MACT).
“Despite their continued calls to rein in the Obama-EPA’s job-killing regulatory agenda, Senate Democrats again voted against a reasonable bipartisan amendment that would do just that,” Senator Inhofe said. “In fact, six out of the twelve Democrat cosponsors of the Collins amendment must have gotten a call from President Obama, as they voted against their own measure. This just goes to show that although Senate Democrats say over and over that EPA regulations are destroying thousands of jobs and increasing energy costs for their constituents, when the time comes, they side with President Obama and his radical environmental base.
“Boiler MACT is in dire need of a legislative fix as it is one of the most ruinous and expensive EPA regulations. It will result in $1 Billion in lost GDP and put 800,000 good paying American jobs, as well as our manufacturing base, at risk. That is why a majority of the United State Senate voted to rein in the EPA.
“The House has already approved legislation to fix EPA’s Boiler MACT rule with overwhelming bipartisan support - 41 Democrats voted in favor of the measure. It’s time for Senate Democrats to stop pandering to President Obama and Majority Leader Reid and stand up for their constituents, who will suffer the most for the hundreds of thousands of lost jobs and skyrocketing energy costs that EPA’s current Boiler MACT rule will inflict.”
Background:
Today Senate Democrats did the same thing they did last April when the Senate voted on Senator Inhofe’s Energy Tax Prevention Act, which was offered as an amendment by Senate Minority Leader Mitch McConnell. This amendment prevented EPA from regulating greenhouse gases under the Clean Air Act, while keeping all Clean Air Act provisions intact. Although Senate Democrats continually said that EPA’s greenhouse gas regulations will be devastating to their constituents, they opted instead to take a cover vote and support alternative amendments: one was Senator Rockefeller’s amendment which only offered a two year delay of these regulations.
The vote on these amendments was a moment of truth for Obama’s job-killing greenhouse gas regulations: 64 senators voted that day, in various ways, against EPA’s cap-and-trade agenda. Each one chose whether to take the “cover vote” or actually to vote with their constituents for the only real solution to the problem: the Energy Tax Prevention Act.
---------------
Senate Democrats Reject Keystone Construction; Side with Obama Instead of Constituents
Washington, D.C. - Senator James Inhofe (R-OK), Ranking Member of the Senate Committee on Environment and Public Works, said today that Senate Democrats sided with President Obama instead of American families by voting against Senator John Hoeven’s (R-ND) amendment to the Boxer-Inhofe highway bill, which allows Congress to overturn President Obama’s rejection of the Keystone pipeline and approve the project immediately.
“Today Senate Democrats decided to stand with President Obama and his far left global warming allies by voting against the construction of the Keystone pipeline,” Senator Inhofe said. “I hope these Democrats feel good about saying ‘no’ to the tens of thousands of jobs, lower gas prices, and the energy security that the pipeline would bring. For all his phony reelection rhetoric about an ‘all-of-the above’ approach, Politico reported today that President Obama has been pressuring Senate Democrats to withdraw their support. Instead of putting American jobs and gas prices first, he’s clearly trying to avoid a PR disaster, as several members of his own party have come to understand the importance of the Keystone pipeline for our economy.
“Of course, Majority Leader Reid has got the President’s back. Just as he did during the vote to stop EPA’s destructive greenhouse gas regulations, Senator Reid allowed an amendment that would give Democrats the chance to appear like they support the Keystone pipeline, while ensuring that the pipeline never gets built. This ‘cover amendment’ sponsored by Senator Wyden, actually creates new barriers and further delays to the construction of the pipeline, and it keeps the decision in the hands of the President who has no intention of approving it. It’s just unfortunate that so many Democrats caved to the pressure. Even so, a majority in the United States Senate supported building the pipeline.
“Approving this project immediately is not just about creating tens of thousands of jobs. With international tensions running high over Iran’s nuclear weapons program, a rejection of Keystone is reckless to the safety and security of the United States and sends the wrong signal to hostile countries - that America’s energy security needs can and will be held hostage by radical environmentalists.
“But the fact that President Obama had to go to such lengths to keep his party in line shows that there is still strong bipartisan support to overturn his rejection of this pipeline as well as his destructive war on affordable energy - and we will continue the fight to get the pipeline built.”
|
|
|
|

